Accessibility
Accessibility is defined first in 1959 as “the potential of opportunities for interaction”, which refers to the ease with which people or goods can be reached from a particular location (Hansen, 1959). In the context of GIS and urban planning, it refers to the ease with which people can reach essential services, such as healthcare facilities, schools, or supermarkets.
Generally, ensuring appropriate accessibility is a critical aspect of urban and transport planning, as it profoundly influences individuals’ quality of life and transportation decisions. Accessibility can be expressed through diverse indicators that aim modelling accessibility at different spatial scales and transport modes.
Accessibility Instrument
An accessibility instrument is a tool used to calculate and analyze the accessibility of a particular location or region. It takes into account factors such as transportation options, distance, and travel time to determine how easily people can access essential services such as healthcare and education. Usually an accessibility instrument is technically based on GIS technology, routing algorithms and different data sources.
Active Mobility
Active mobility refers to the use of human-powered modes of transport, such as walking, and cycling. It is an important part of sustainable transport as it reduces car dependency and is emission-free. Active mobility also has many health benefits, such as reducing the risk of obesity and cardiovascular disease.
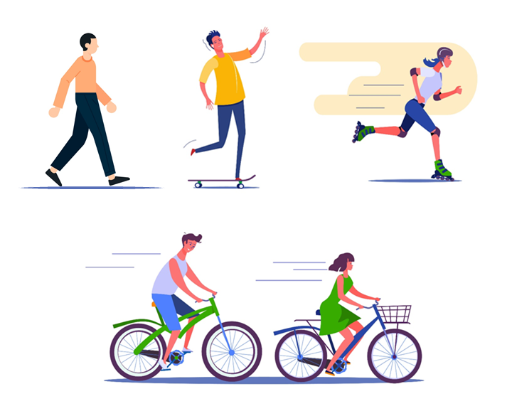
Designed by pch.vector / Freepik
Area of Interest (AOI)
An Area of Interest (AOI) is a specific geographical region or boundary that is of particular interest or importance to a particular study or analysis. It can be a watershed, a forest, a park or any other geographic area relevant to the study. The AOI is usually defined by a set of coordinates or a polygonal boundary that encompasses the region of interest.
Connectivity
Connectivity refers to the degree to which paths are connected to each other. The higher the path and intersection density, the higher the connectivity. The main obstacles to connectivity are, for example, rivers, railway lines, and highways.
Connectivity has a direct impact on accessibility, as it is decisive for the travel time to reach a certain destination. High connectivity is especially important for active modes, as these modes are particularly sensitive to detours. Thus, high connectivity is key to ensure accessibility to services and amenities and to promote sustainable mobility.
H3 Grid 
The H3 grid is a geospatial indexing system by Uber Technologies that partitions the Earth’s surface into a hierarchical grid of hexagonal cells for more efficient and accurate representation and analysis of geospatial data. It uses a hexagonal tiling approach based on an icosahedron, creating a hierarchical structure with multiple levels of resolution. The hexagonal shape allows for equidistant and consistent spatial representation, with different resolutions. The resolution 10 (approx. 75m edge length) is used in GOAT for computing travel-times and resolution 9 (approx. 200m edge length) or higher is used for visualization of heatmaps. Values are aggregated from the higher to lower resolution by computing the mean.

Image: Uber
Heatmap
A heatmap is a graphical visualization form that uses different colors to indicate the different values of a dataset. This allows for a quick understanding of the data presented.
In GOAT, we, among others, use heatmaps to analyse the local accessibility (see Heatmaps) of different amenities, such as cafes, restaurants or supermarkets. The heatmap utilizes a range of colors to represent various accessibility values. By analyzing this data, we can gain insights into the distribution of destinations and the quality of infrastructure available.
Indicator
An indicator is a mean to analyze a specific attribute or topic in a quantitative way. Usually, a standardised procedure is applied for this, e.g. by using a formula. In planning, indicators can be used to assess the current situation, to compare different locations with each other, as well as to monitor the progress towards specific goals or objectives, such as improving accessibility.
Isochrone
An isochrone or catchment area is an indicator that shows how far people can travel in a given time with a given speed from a selected location. Isochrones can be calculated for any mode such as walking, cycling, car or public transport. Depending on the selected mode, the corresponding routing network is used.
You can find further information on how we perform isochrone calculations in our indicator documentation.
Land Use
Land use is the categorization and management of land according to its functional role within a specific area. This includes a range of purposes such as residential, commercial, industrial, and natural or conservation uses. Additionally, land use incorporates aspects of urban planning and environmental management, as the manner in which land is utilized significantly influences factors like population density and the distribution of destinations. Consequently, land use has a direct and substantial impact on accessibility, affecting the availability of services, transport connectivity, and liveability of an area.
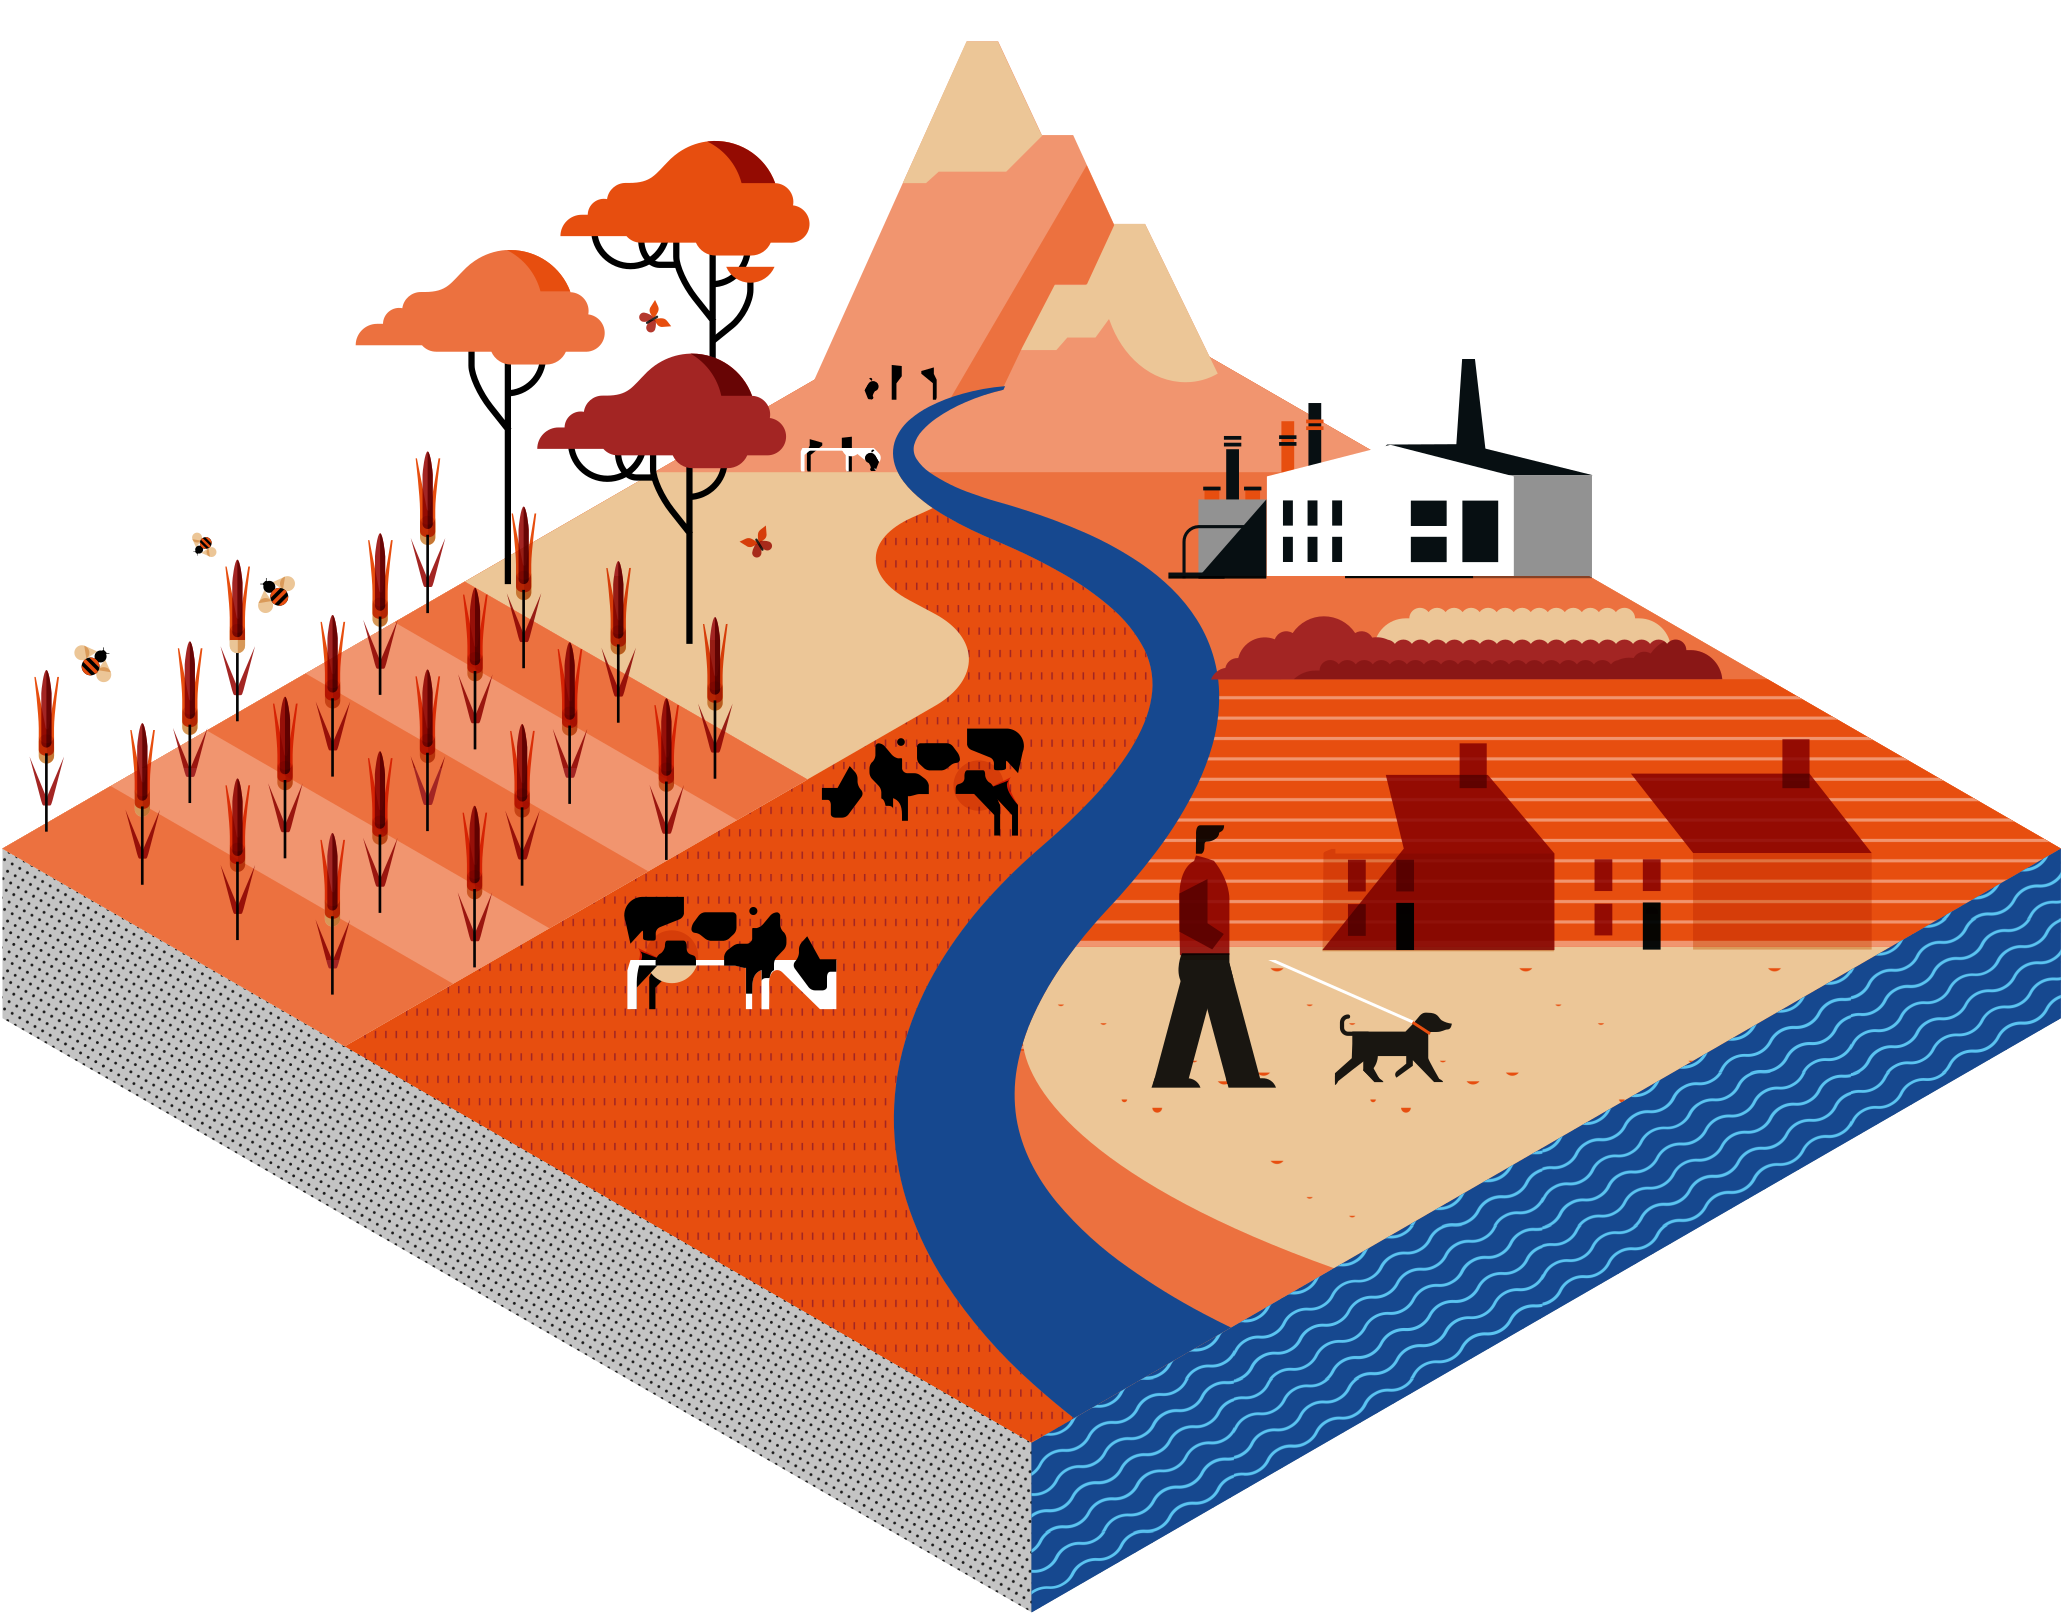
Image: Chatham House Sustainability Accelerator
Local Accessibility
Local accessibility, also known as neighborhood-level accessibility, refers to the ease with which people can access essential services within a specific neighborhood or area (Handy, 1992). It usually refers to active modes of transport and is focusing on short travel distances.
Micromobility
Micromobility is a growing trend in urban transportation, involving small, lightweight vehicles like electric scooters and skateboards. These compact modes of transport offer convenient solutions for short-distance travel.

Designed by pch.vector / Freepik
Open Source 
Open source refers to software or other products that are made available to the public with their source code freely accessible and modifiable. This allows individuals and organizations to modify and improve the product as needed, without restrictions on use or distribution.
Planning Support System (PSS)
A planning support system is a digital tool used to support the planning and decision-making process for urban and regional development. It uses data and models to provide information on various aspects of planning, such as land use, transportation, and environmental impact. A PPS allows planners to explore different scenarios and evaluate the potential outcomes of their decisions.
Point of Interest (POI)
A Point of Interest (POI) refers to a distinct location or site that holds significant relevance or value within a specific context, study, or analysis. In the context of GOAT, POIs mainly refer to amenities of daily need, such as supermarkets, kindergartens or restaurants.
Quintile Classification
Quintile classification is a commonly used method in Geographic Information Systems (GIS) to divide data into equal groups based on their values. This method is useful for analyzing and visualizing patterns in data and can help identify trends and patterns that may not be obvious easily.
In GIS, quintile classification is often used to create choropleth maps, which are maps that use color to represent different values of a variable. For example, a choropleth map of the population density of a city. The map would be divided into five color-coded categories, with each category representing a different range of population densities.
The accessibility heatmaps in GOAT use quintile classification to determine what is high or low accessible. For the classification, we first assign all zero values which have “no accessibility” and then we sort the data from lowest to highest. We divide the data into 6 equal groups, each containing 20% of the total data. The values in each group are assigned a rank from 0 to 5, with 0 being the lowest (no accessibility) and 5 being the highest (very high accessibility).
Routing 
Routing refers to the process of finding the fastest or shortest path from one location to another. This is commonly used in transportation planning and navigation systems to help people get from point A to point B but is also crucial to accessibility analysis.
Sustainability 
Sustainability refers to meeting the needs of the present without compromising the ability of future generations to meet their own needs. In the context of urban and regional development, sustainability involves balancing economic, social, and environmental factors to create livable and resilient communities. This includes reducing carbon emissions, promoting active mobility, and preserving natural resources.
Transport Mode
Transport mode refers to the type of transportation used for a particular trip or journey. This can include modes such as transit (bus, train, subway), cycling (pedelec, bike), walking, and driving. The choice of transport mode can have a significant impact on factors such as travel time, cost, and environmental impact.
References
Hansen, W.G. (1959). How accessibility shapes land use. Journal of the American Institute of Planners. 25, 73–76. https://doi.org/10.1080/01944365908978307
Handy, S. L. (1992). Regional Versus Local Accessibility: Neo-Traditional Development and its Implications for Non-work Travel. Built Environment (1978-), 18(4), 253–267. http://www.jstor.org/stable/23288518