Need for Data
Data, data, and more data! While working on the mFUND project to bring GOAT’s features to the municipality of Fürstenfeldbruck, we have been looking for available information from many sources to accomplish the objectives.
As always, OpenStreetMap has been a great source of information, a lot of details are still missing. Here comes Mapillary into play. The easy way to describe it would be “the Google Street View of open source”. People from all over the world have captured imagery from their cars, bikes, or just by walking millions of kilometers of city streets, roads, pedestrian, and bicycle paths to have an up-to-date source of what is going on in the streets. But that is not everything, Mapillary’s magic lies in their machine-generated map feature, with which they can automatically detect different objects from the images (traffic signs, fire hydrant, lane markings, bicycle racks, etc.) and estimate their position on the map.
Mapillary in Fürstenfeldbruck
Since in Fürstenfeldbruck only a few parts of the road network were captured beforehand, we decided to go outside and take the pictures ourselves. This screenshot shows our coverage:

Figure 1. Fürstenfeldbruck Area and pictured links
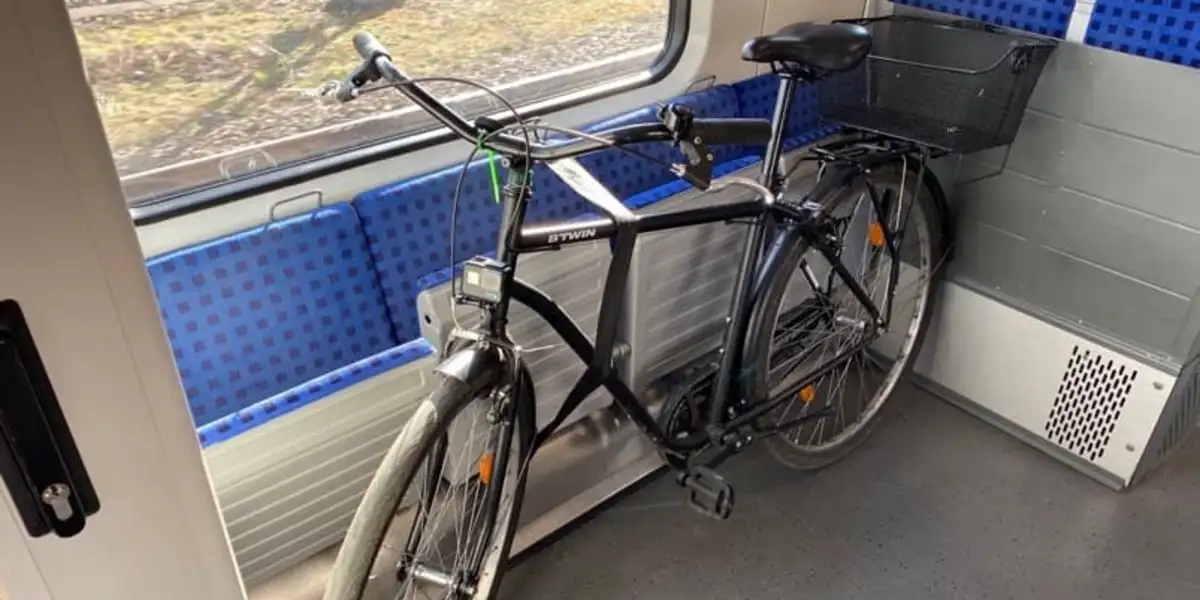
To learn how to work with Mapillary, we made some tests in Munich before going to Fürstenfeldbruck. During the test, we tried different kinds of cameras, holding devices to attach the phone/GoPro to the bicycle, settings for recording, and different features of the app. Especially the high battery consumption and the high memory requirements for storing all images were challenging. The best set-up proved to be a GoPro for the pictures connected to a mobile phone for recording the GPS track and orientation (north-south), additionally equipped with a power bank.

Figure 2. Bicycle with the GoPro in the S-Bahn on our way to Fürstenfeldbruck
So far, within the area, we have pictured 210 km in 8 days. Compared to the estimated working time in the planning stage (5 days for 240 km), the actual working time was around 2:30 hours per day (limited through the duration of the battery) and the average cycling speed was about 10 km/h because it is necessary to cross the same streets several times. There are very few areas and footpaths remaining but most of the streets are now covered. To face the lower picture rate, we organized a group day where 4 members from the GOAT community went together to take pictures of nearby villages.
Joint Capturing
To organize this task, Mapillary has a feature called “Capture projects”. With this feature, the user defines the general area that he wants to cover as a shape, in our case Fürstenfeldbruck. Then, the shape is divided into subareas, each of them is called a “task” and is assigned to the “drivers” that are members of the group (Figure 3). Before going to the city, everybody downloaded an app called “Mapillary Driver”, where every driver can see to which area they are assigned and for which streets pictures are missing. In that way, it is very easy to complete all the tasks.

Figure 3. Fürstenfeldbruck area divided by tasks and the assignment to each driver
By doing this fieldwork, we are providing new data and improving the existing data available to develop GOAT’s features in Fürstenfeldbruck, but at the same time, we are very happy to share the data with everybody out there. The information provided by the pictures and the machine-generation tools from Mapillary help to develop the data for better calculations.
Implementing the Images in GOAT
And the possibility to see up-to-date images makes it easy to remotely analyze the street.
Figure 4. The Mapillary images can now be viewed directly in GOAT
This allows to verify details such as the quality of sidewalks or cycle paths; land use, as shown in the pictures below where it is possible to identify residential areas with 30 zones or calmed roads, commercial areas to analyze parking distribution or footpaths, and the quality of the road surface; schools, health buildings, points of interest and even the possibility to find bicycle racks.

Figure 5. Captured sequences within different land-use areas
Improvement of OSM
Mapillary data was used to improve the quality of OpenStreetMap data. As shown in the picture below, Mapillary photos can easily and directly be used when editing in OSM. The taken photos in the Fürstenfeldbruck area are shown as green dots.

Figure 6. Using Mapillary pictures to improve OSM data
We used the data so far mainly to complete the attributes of the street network in OpenStreetMap. Based on the Mapillary photos, many relevant attributes could be collected that are important to provide a more realistic cycling routing. As an example, it is possible to identify the type of surface (paved, unpaved, asphalt, concrete, paving stones, …) or smoothness (excellent, good, intermediate, bad, …) of a road or path. It is also possible to identify if a road is designed for bicycles and pedestrians and many more…
We will keep on collecting more imagery and fine-tune our used methodology to build better map data for all!