What is a cycling concept?
A bicycle traffic concept can help to reduce current problems of bicycle traffic such as high accident rates. The focus can either be on the establishment of a new bicycle route network or on the expansion and optimization of existing routes.
Both should result in an increase in the share of cycling and a decrease the motorized private transport use within the population (Amt für Stadtentwicklung, Stadtplanung, Verkehrsplanung, 2016).
What can GOAT contribute to this?
Visualization of accidents
GOAT can create an overview of dangerous places and intersections with the help of a visualization of accident locations, which is conducive to a subsequent development of measures to prevent accidents. There are different forms of visualization, for example points.
In order to expand or rebuild the cycling network, a redistribution of traffic areas is necessary in many cases (Amt für Stadtentwicklung, Stadtplanung, Verkehrsplanung, 2016, p. 5). GOAT allows you to identify gaps in the cycling network, create new path connections using the scenario function, and evaluate the impact on connectivity.
Improving connectivity
The impact of closing gaps or connecting bike paths is dynamically displayed. Figure 1 shows an example of the change in the path network and connectivity due to the creation of a new bicycle bridge over the Isar River (shown in orange).

Figure 1: Scenario for the construction of a bicycle bridge in GOAT
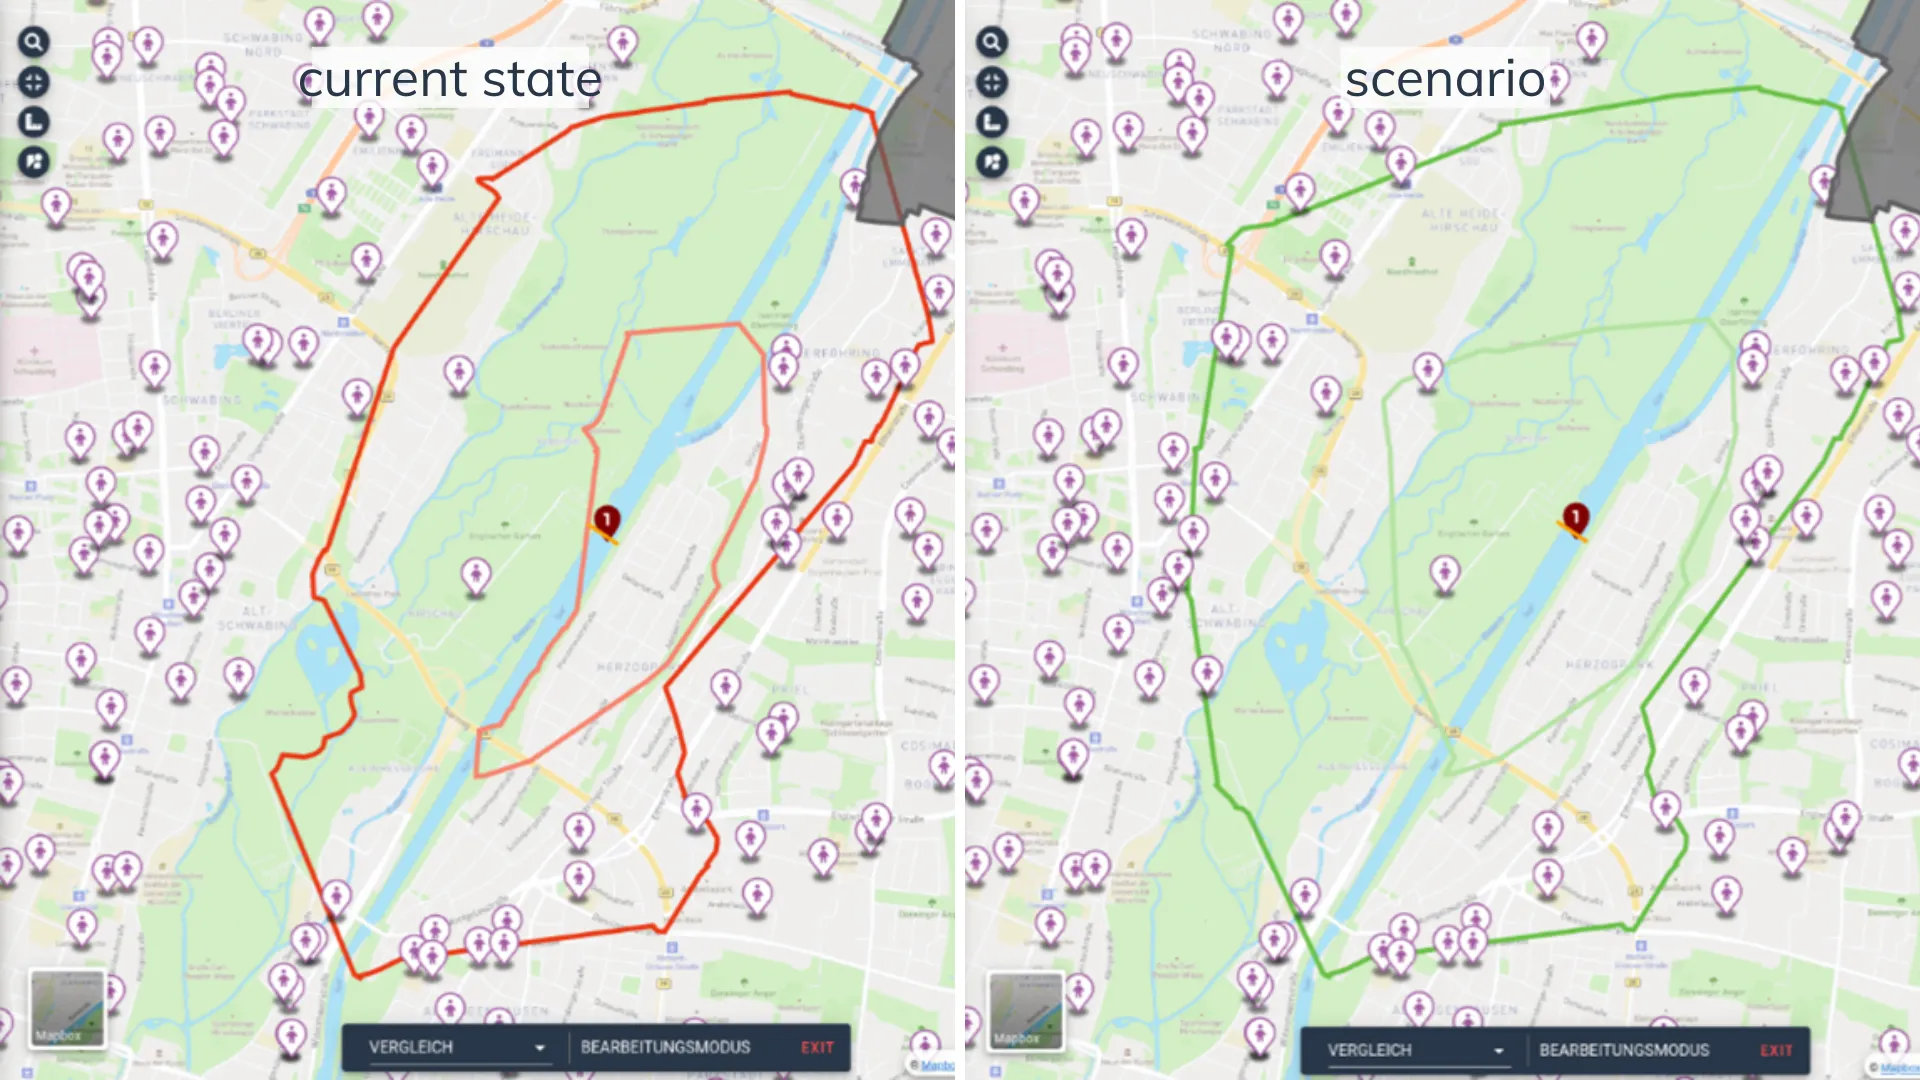
The improved connectivity of the paths also results in higher accessibility to various POIs such as supermarkets or kindergartens. The comparison of accessibility before and after the creation of a new path connection can be displayed in GOAT using isochrones (see Figure 2).

Figure 2: Accessibility Comparison – current state vs. scenario
For example, 16 kindergartens can be reached by bicycle within 10 minutes travel time in the current state (red isochrones) and 25 in the scenario (green isochrones). When considering a 5-minute travel time (the inner isochrones), not a single kindergarten can be reached in the current condition, but two can be reached with the new bicycle bridge.
Accessibility to public transport and shared services
GOAT is also suitable for showing how cycling and public transport are linked. For example, bus stops and train stations can be displayed and the accessibility to them can be calculated. By means of travel time isochrones, it is possible to show, among other things, how many people reach a station by bicycle within 5 minutes.
Bikesharing systems serve as a supplement to the own bicycle. In GOAT, existing stations and the accessibility to them can be visualized using heatmaps.
By comparing supply (existing bikesharing stations) and demand (population, jobs, etc.), gaps in supply can be identified and suitable locations for new stations can be identified using the interactive scenario function.
Supplementary spatial data
As a supplement, data from bicycle counting stations, air and repair stations, bicycle repair shops, and bicycle parking facilities can be integrated as POIs into the planning software and contribute to the process of expanding and reconstructing bicycle networks.
Test GOAT!
You also want to perform analyses of bicycle traffic concepts with GOAT or are interested in further functions? Contact us or test the free GOAT demo!
Further use cases for GOAT can be found here.
References
Amt für Stadtentwicklung, Stadtplanung, Verkehrsplanung, 2016. Radverkehrskonzept - Münster 2025. City of Münster, Münster.


