Description of the feature
Isochrones are isolines connecting all points that can be reached from a specific starting point within a certain time interval. GOAT allows the calculation of isochrones that take factors such as speed, infrastructure network, and traveling time into account. This can be adjusted automatically by choosing between the modes “Walking”, “Bike”, “Pedelec”, “Transit” or “Car”. Isochrones can be used as an indicator of accessibility in one specific location.
Possible use cases (planning questions)
- How many supermarkets can be reached from a certain point in a 10-minute walk?
- How many people can access a public transport station within 5 minutes of cycling?
- How many people can access a specific location within 20min by rail-based public transport (tram, underground, train)?
Video Tutorial
Step-by-step tutorials for exemplary planning tasks
1 Walking accessibility to supermarkets
1.1 Planning question
How many supermarkets can be reached from a certain point in 10 minutes walking?
1.2 Step-by-Step guide
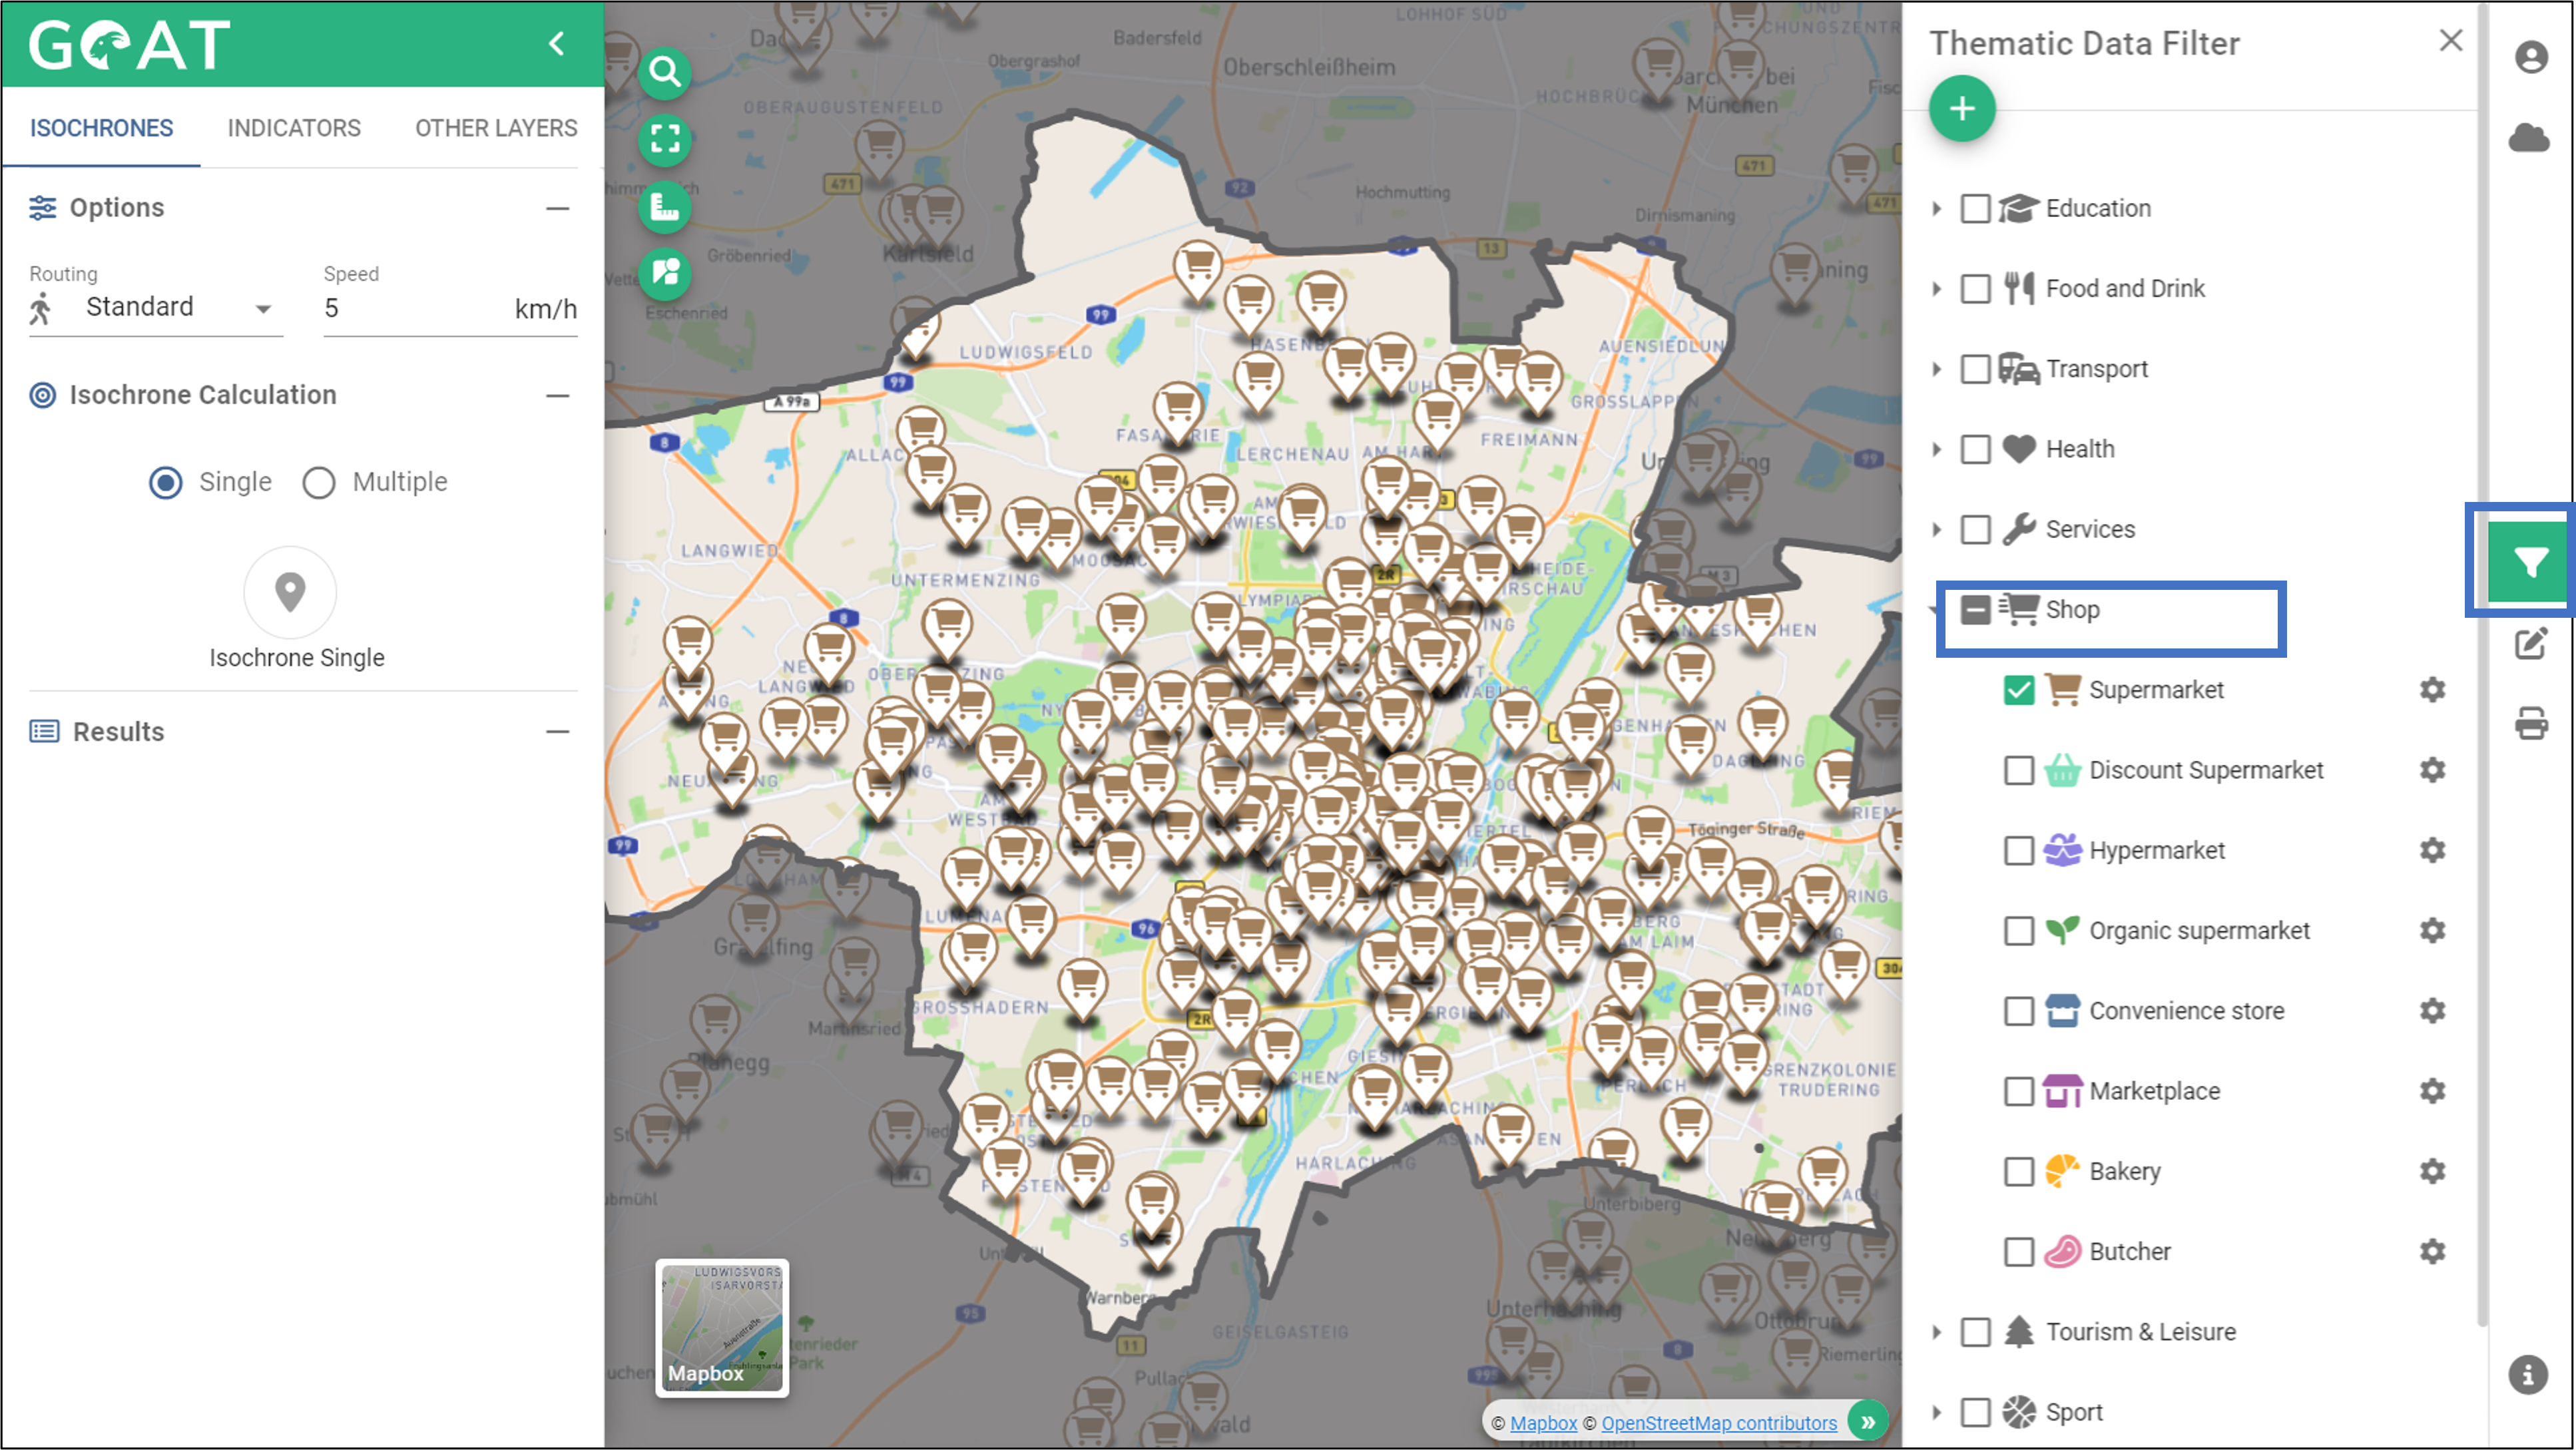
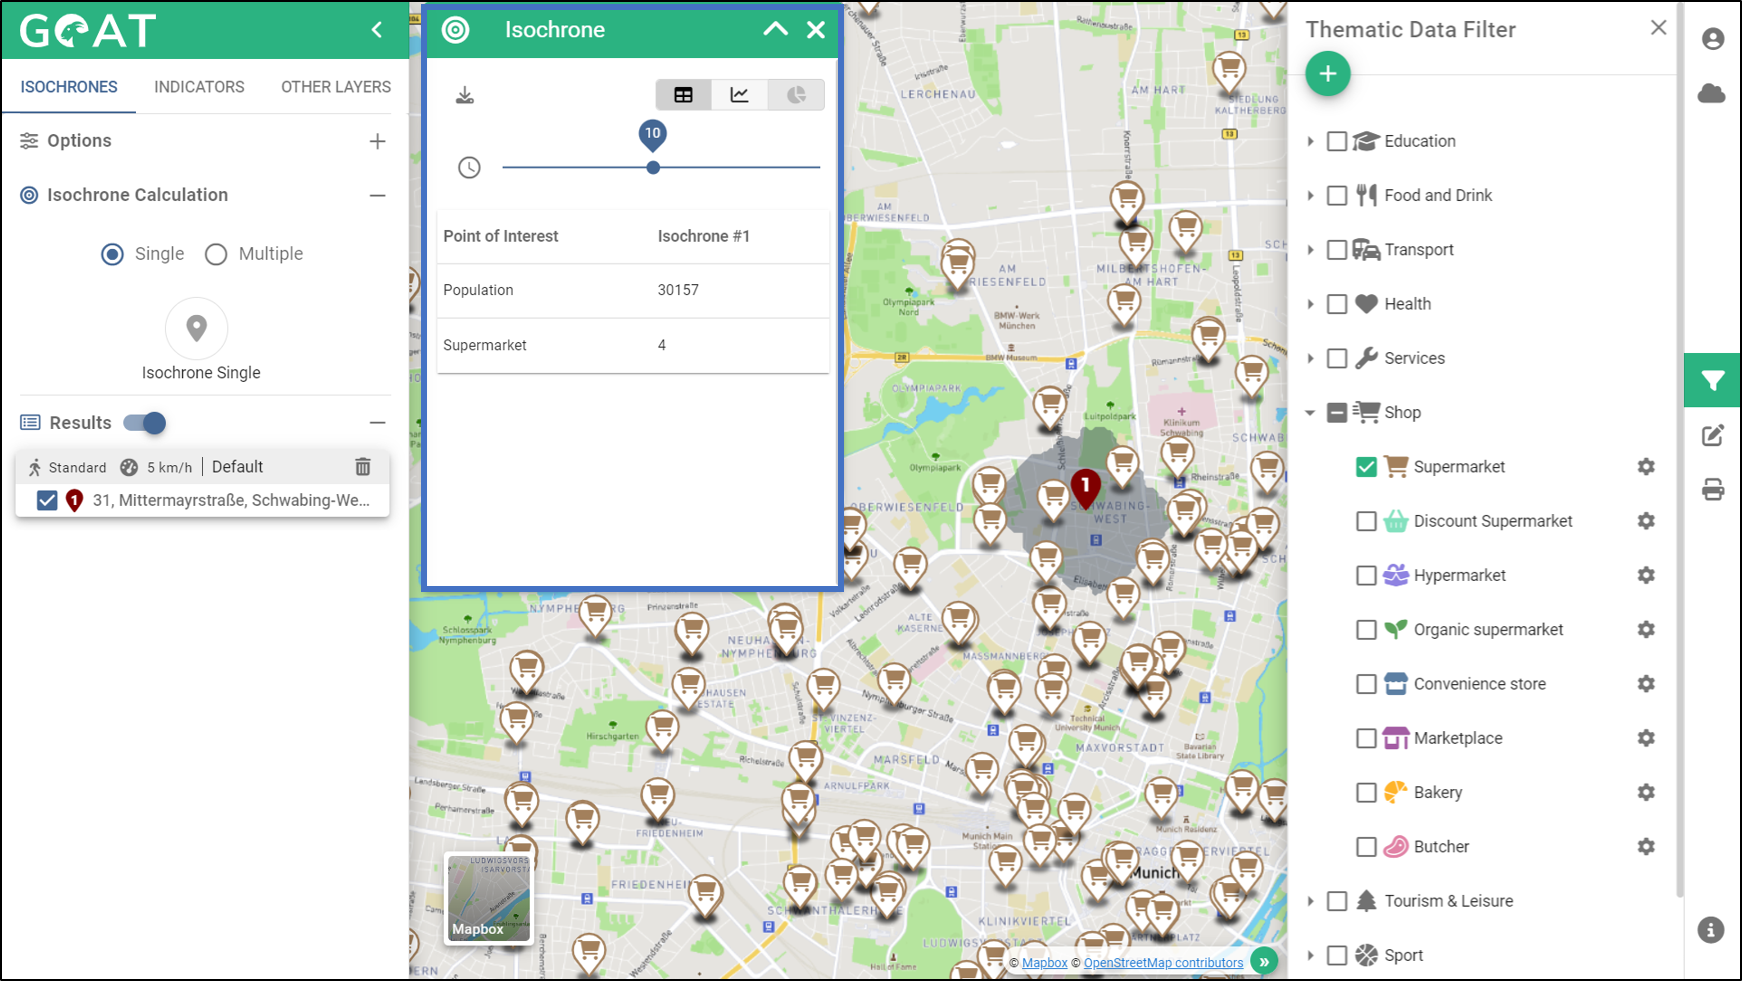
- Display all supermarkets by enabling the amenity “Supermarket” in the Thematic Data Filter under the category “Shop”.
Zoom in into the area where you want to calculate the isochrone.
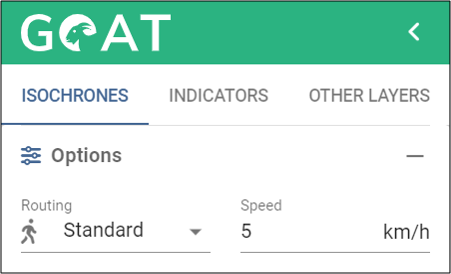
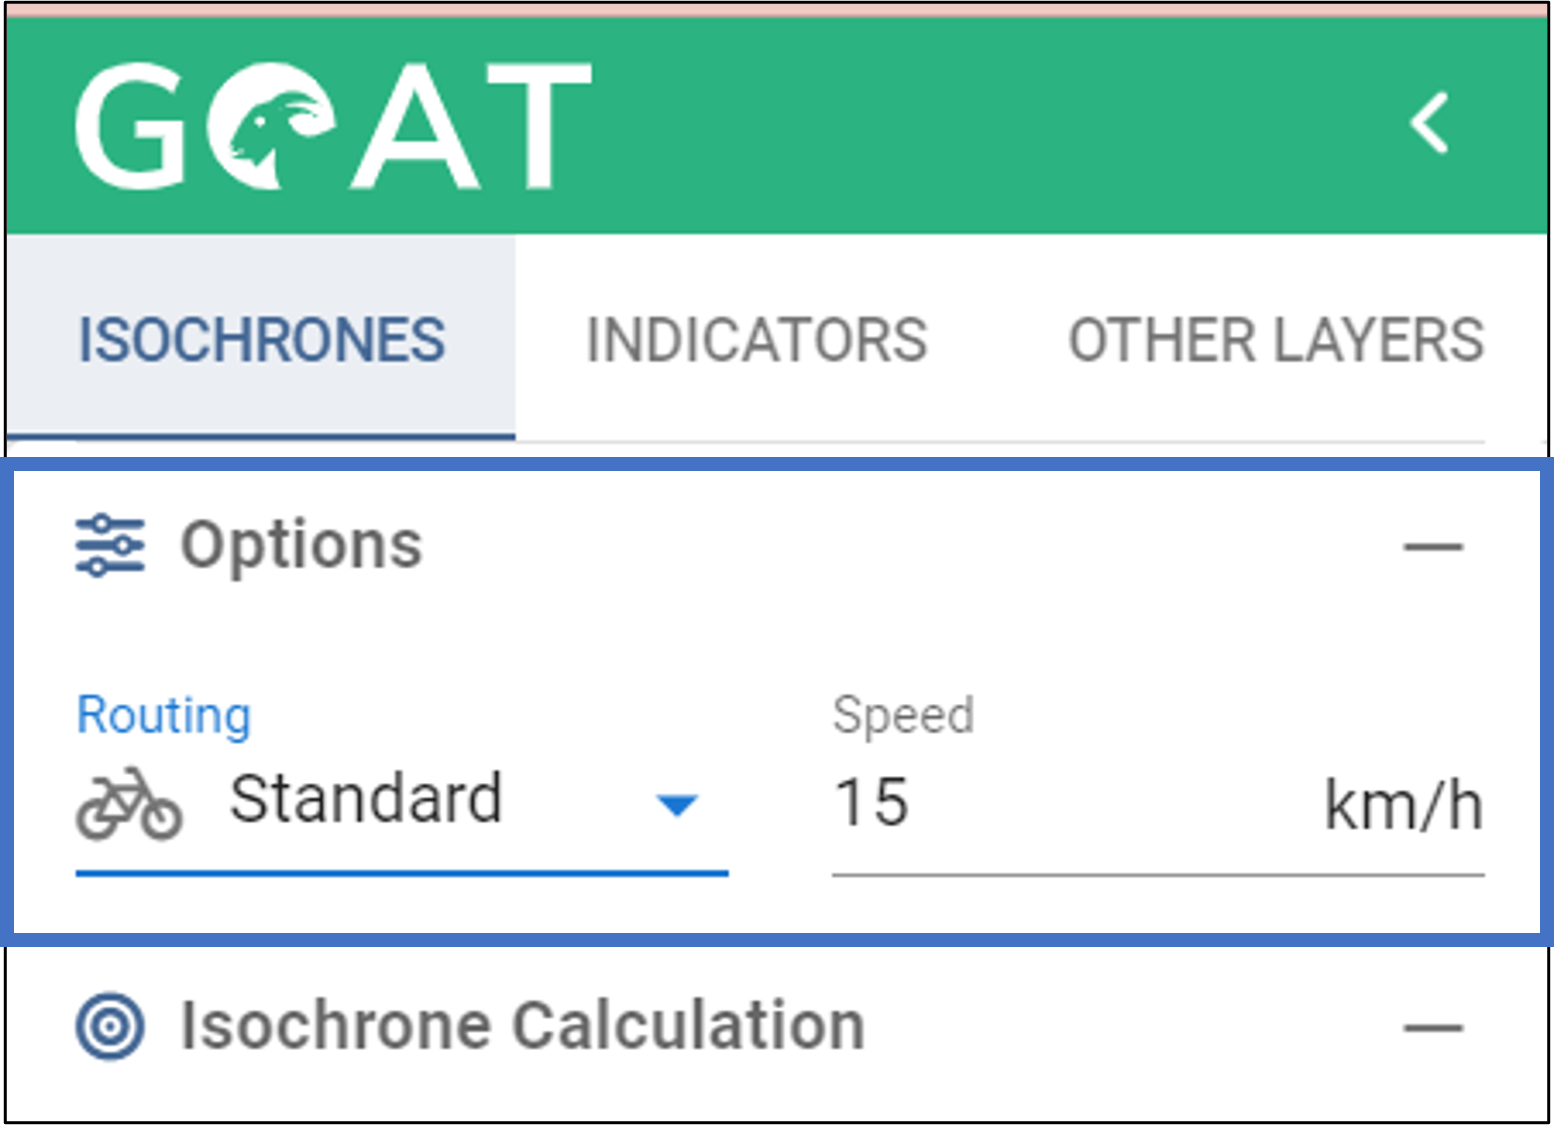
Select the the routing profile and the desired walking speed.
- Place the starting point for the isochrone.
- After the calculation has been carried out, a window with the results opens automatically. From this window you can see the number of supermarkets that can be reached within 10 minutes.
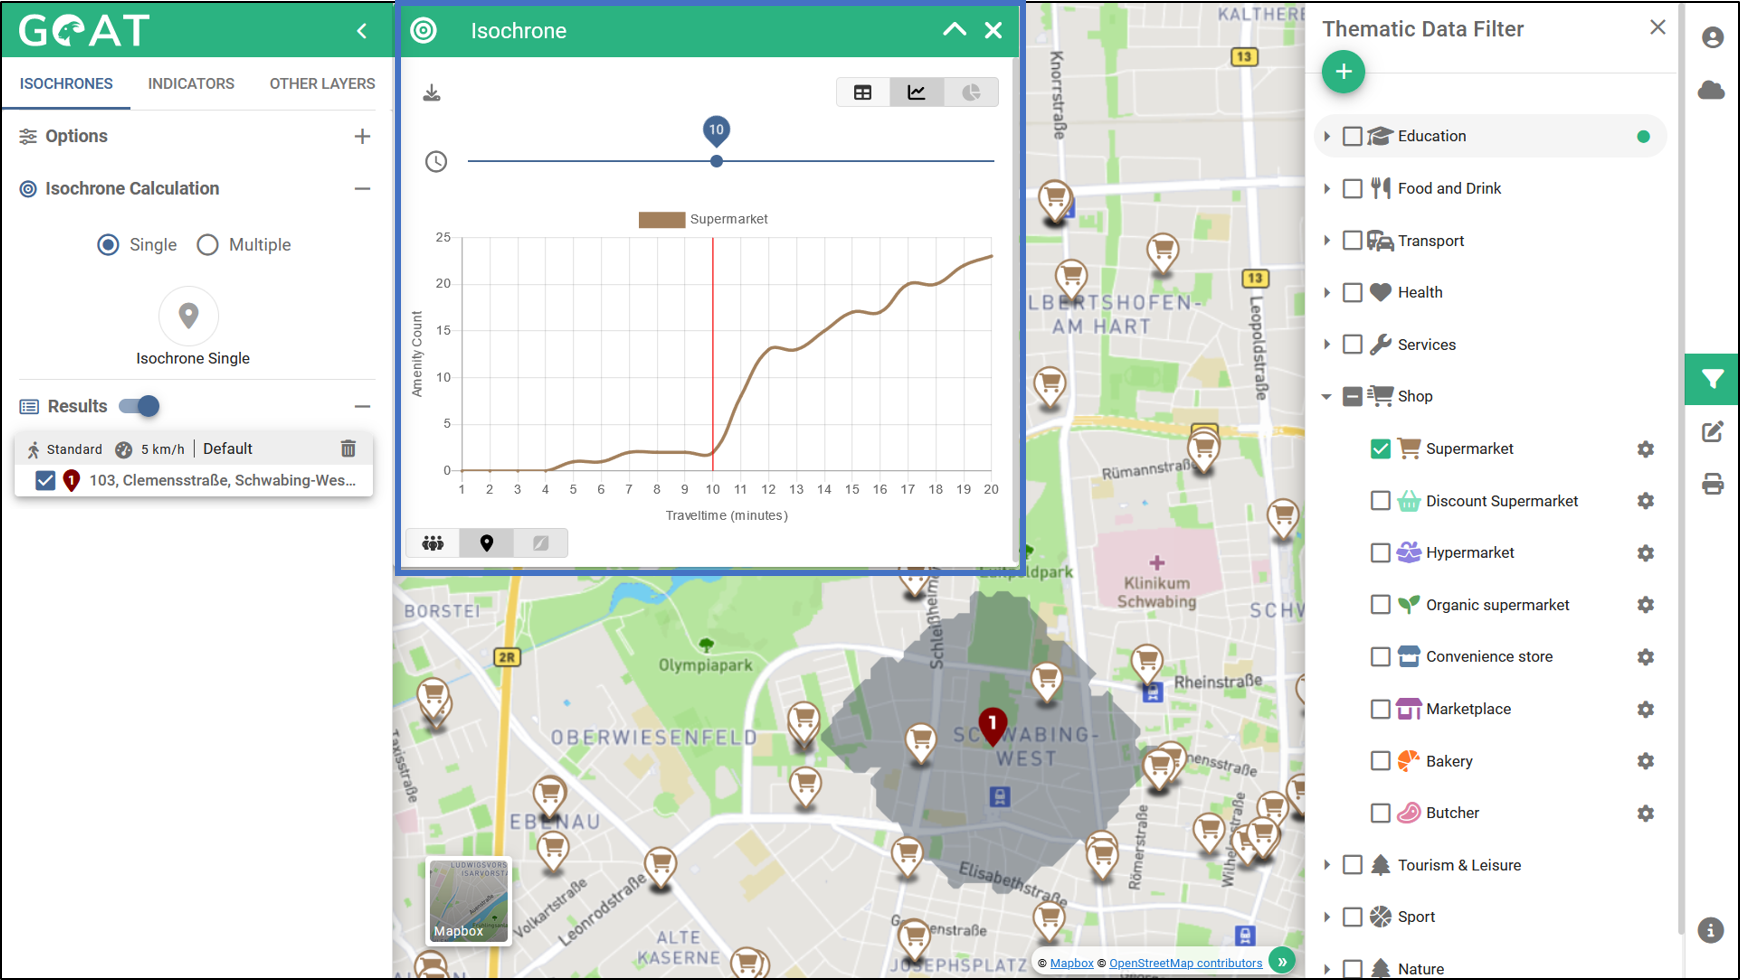
- In the result window that opens, the results can be analyzed by the use of different graphs. Therewith it can be seen how the supermarkets are spacial distributed.
2 Accessibility by bike
2.1 Planning question
How many people can reach the train station within 5 minutes by bike?
2.2 Step-by-Step guide
- Change the routing mode to “cycling” and choose the desired speed.
- Place the starting point for the isochrone calculation on the station.
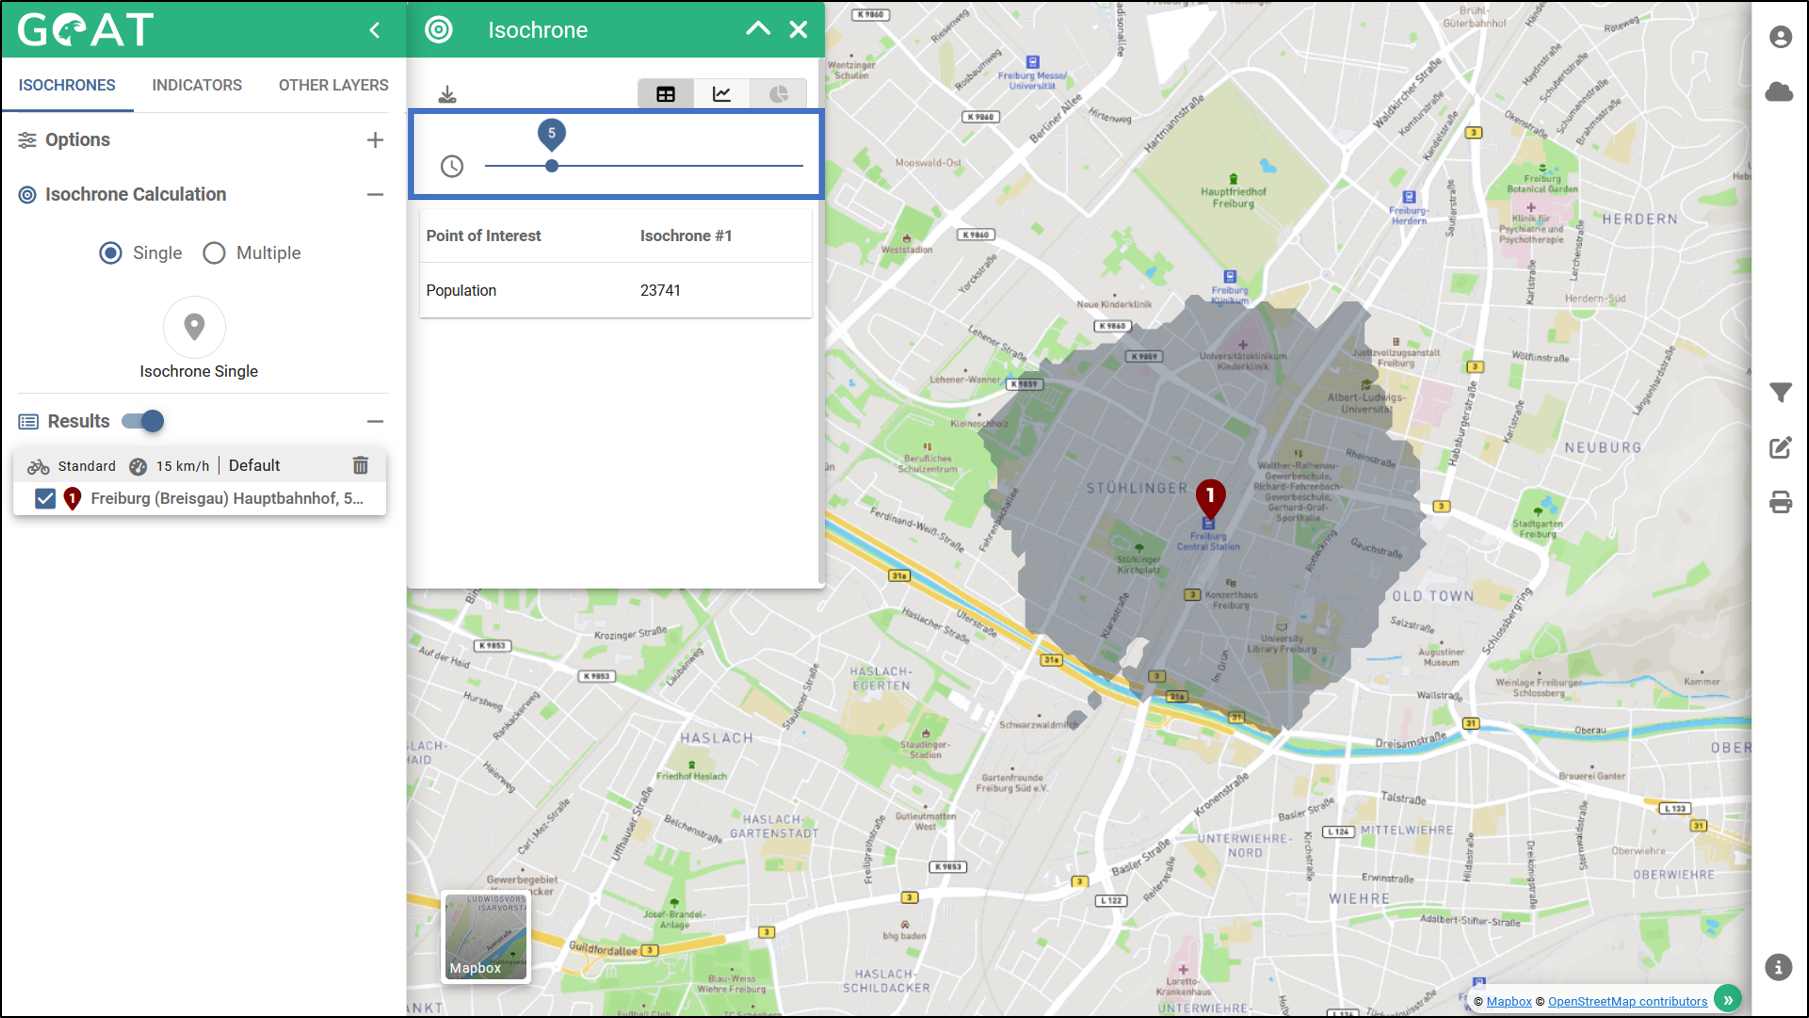
- After the calculation has been carried out, a window with the results opens automatically. From this window you can see the population that can reach the train station within 10 minutes of cycling.
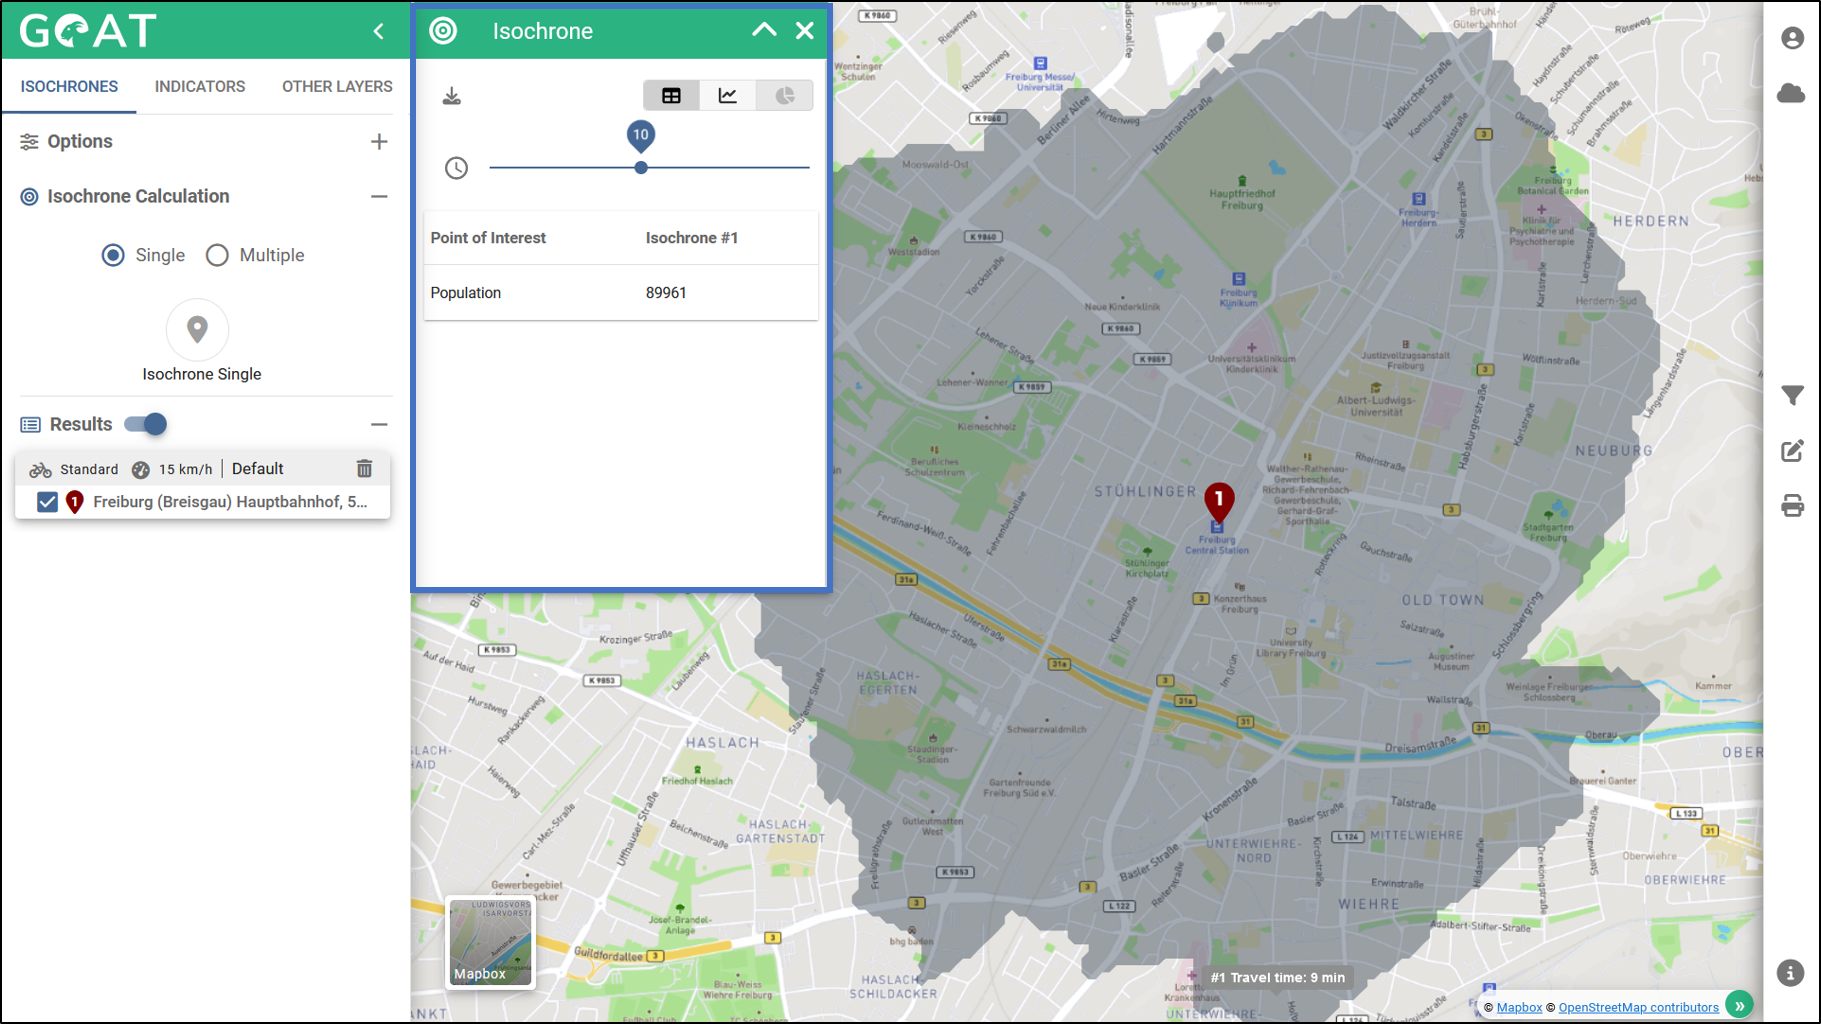
- The travel time can interactively be adjusted to 5 minutes by moving the slider.
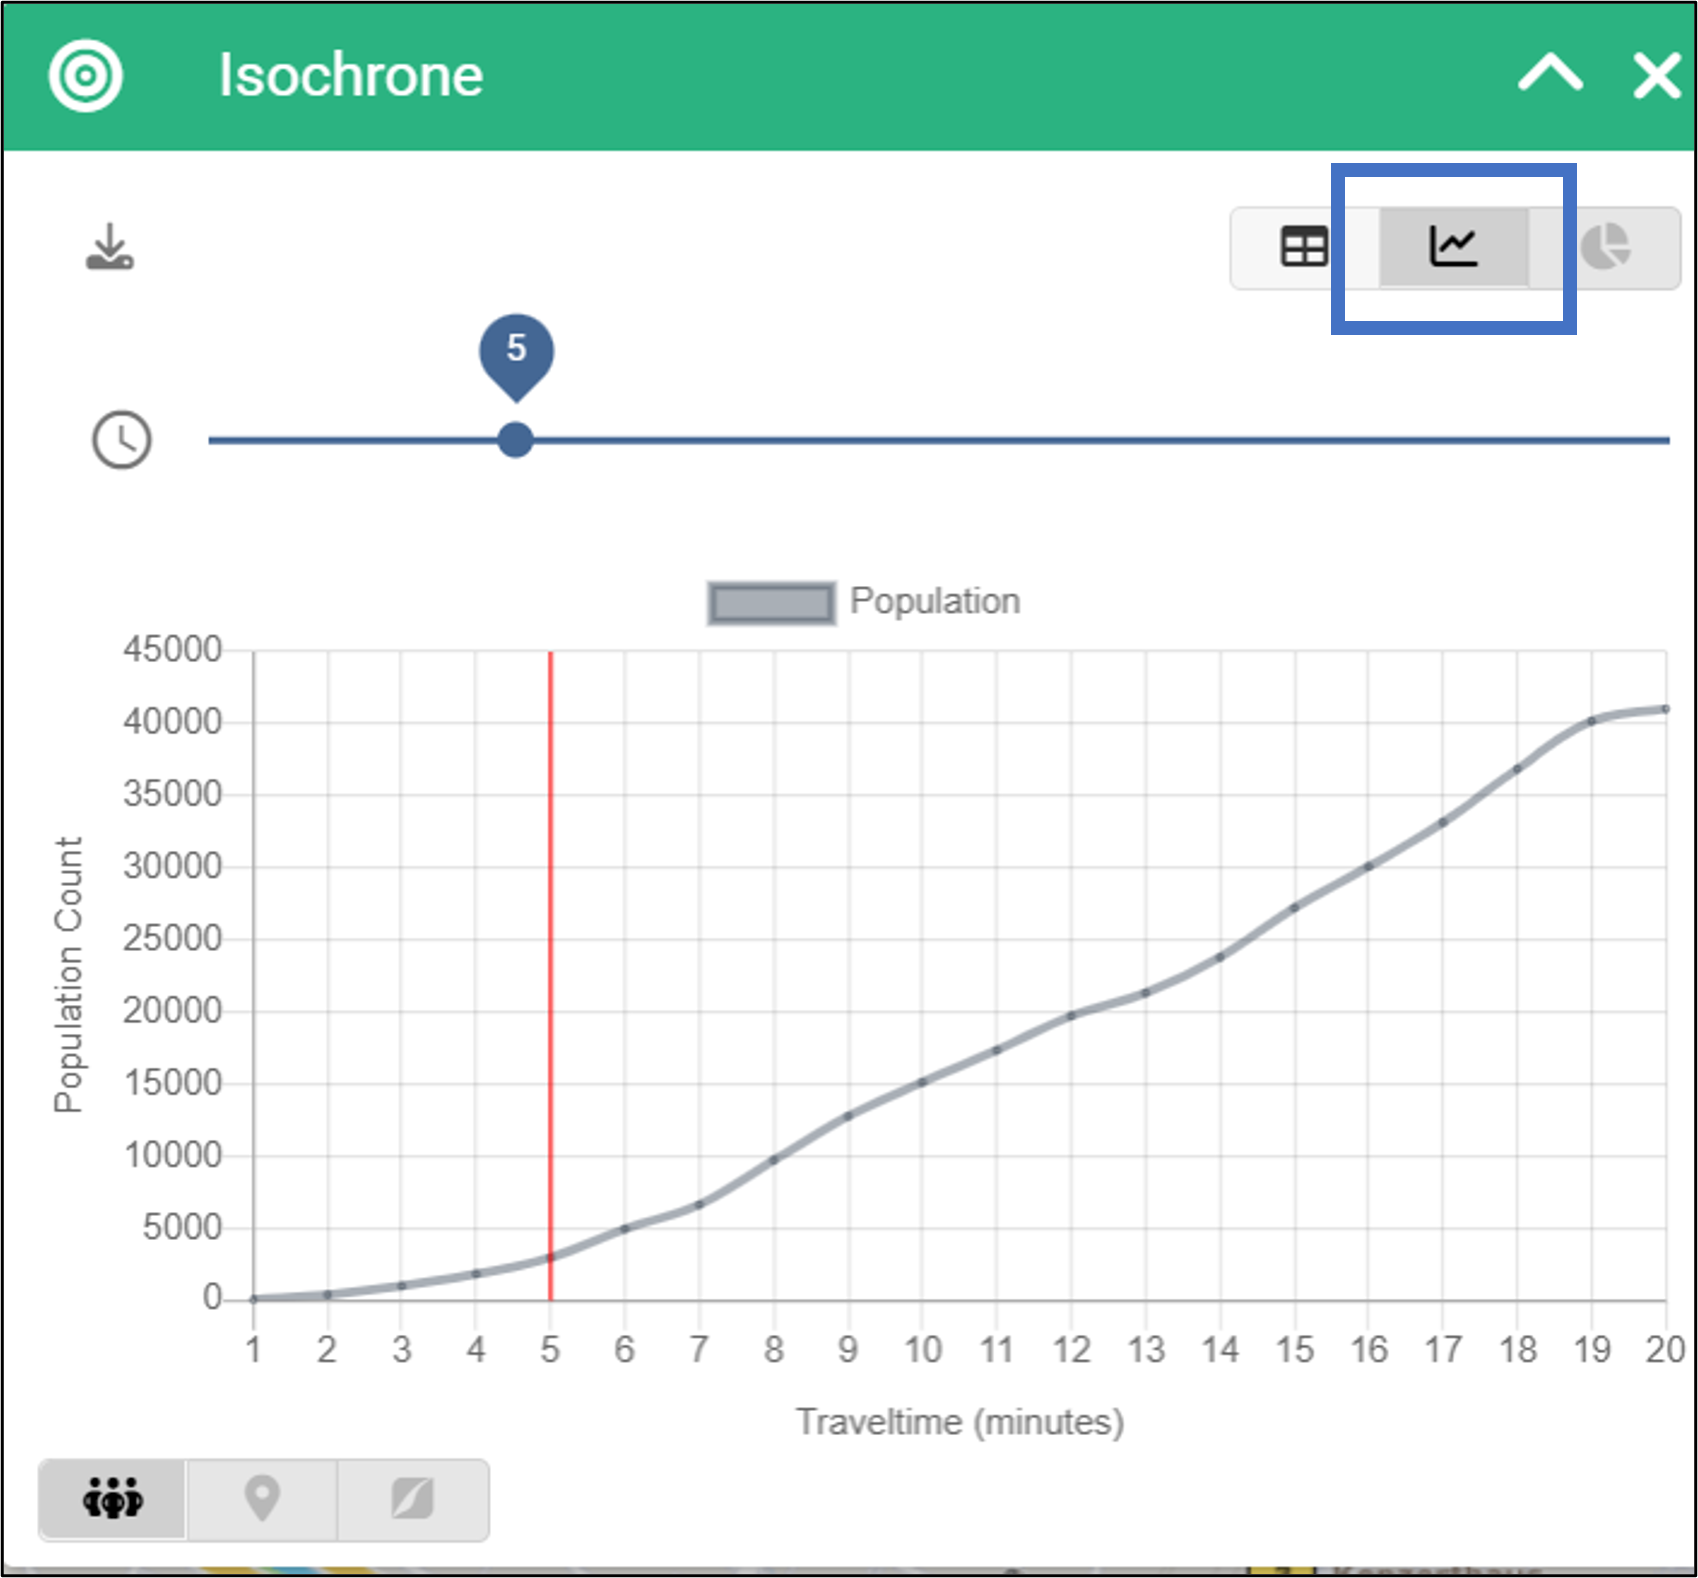
- Besides the table, the population count can be visualized in a graph.
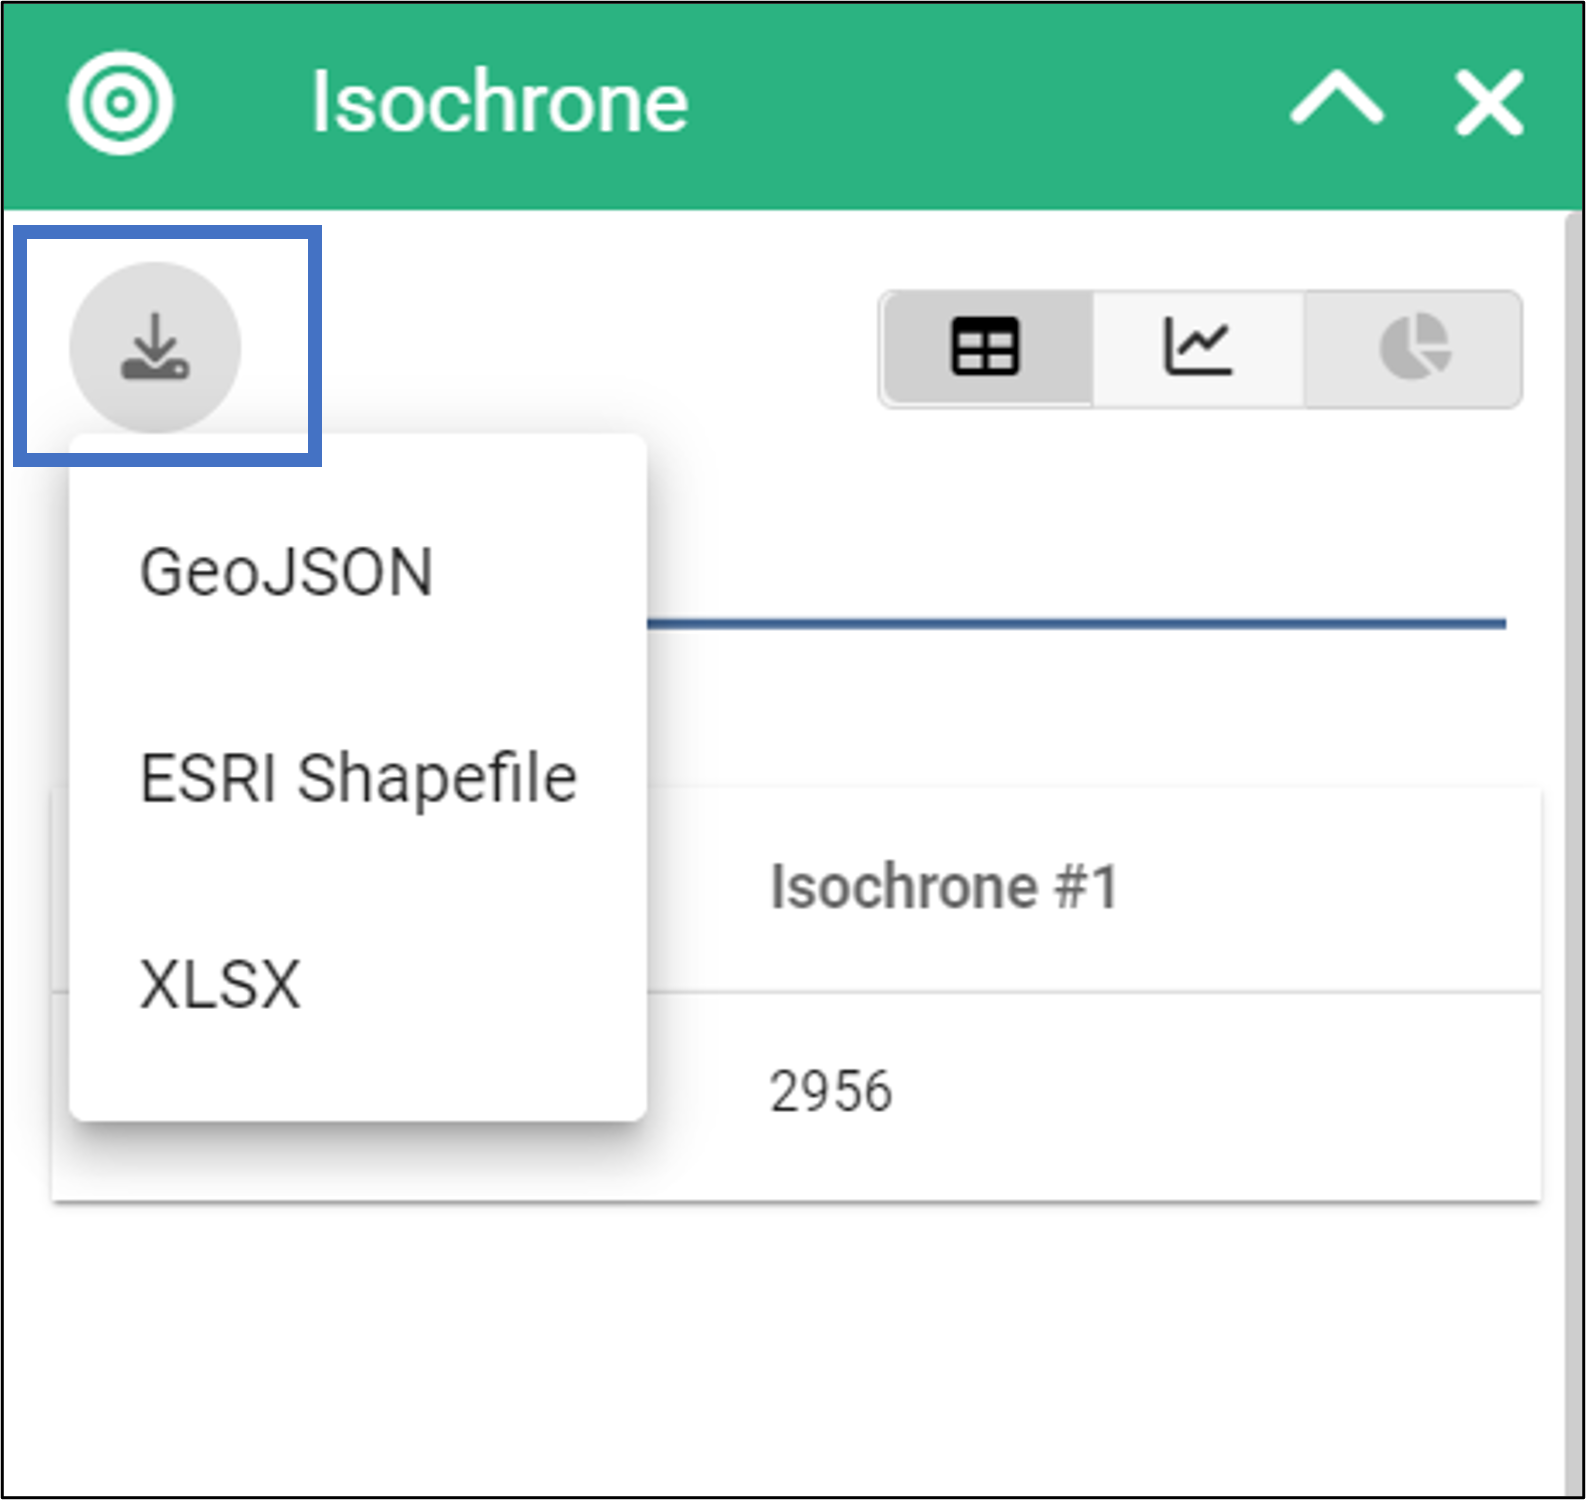
- By clicking on the download button you can download the isochrones as GeoJSON, Shapefile or XML and the result table as Excel file.
3 Accessibility by public transport
3.1 Planning question
How many people can access a specific location within 20min by rail-based public transport (tram, underground, train)?
3.2 Step-by-Step guide
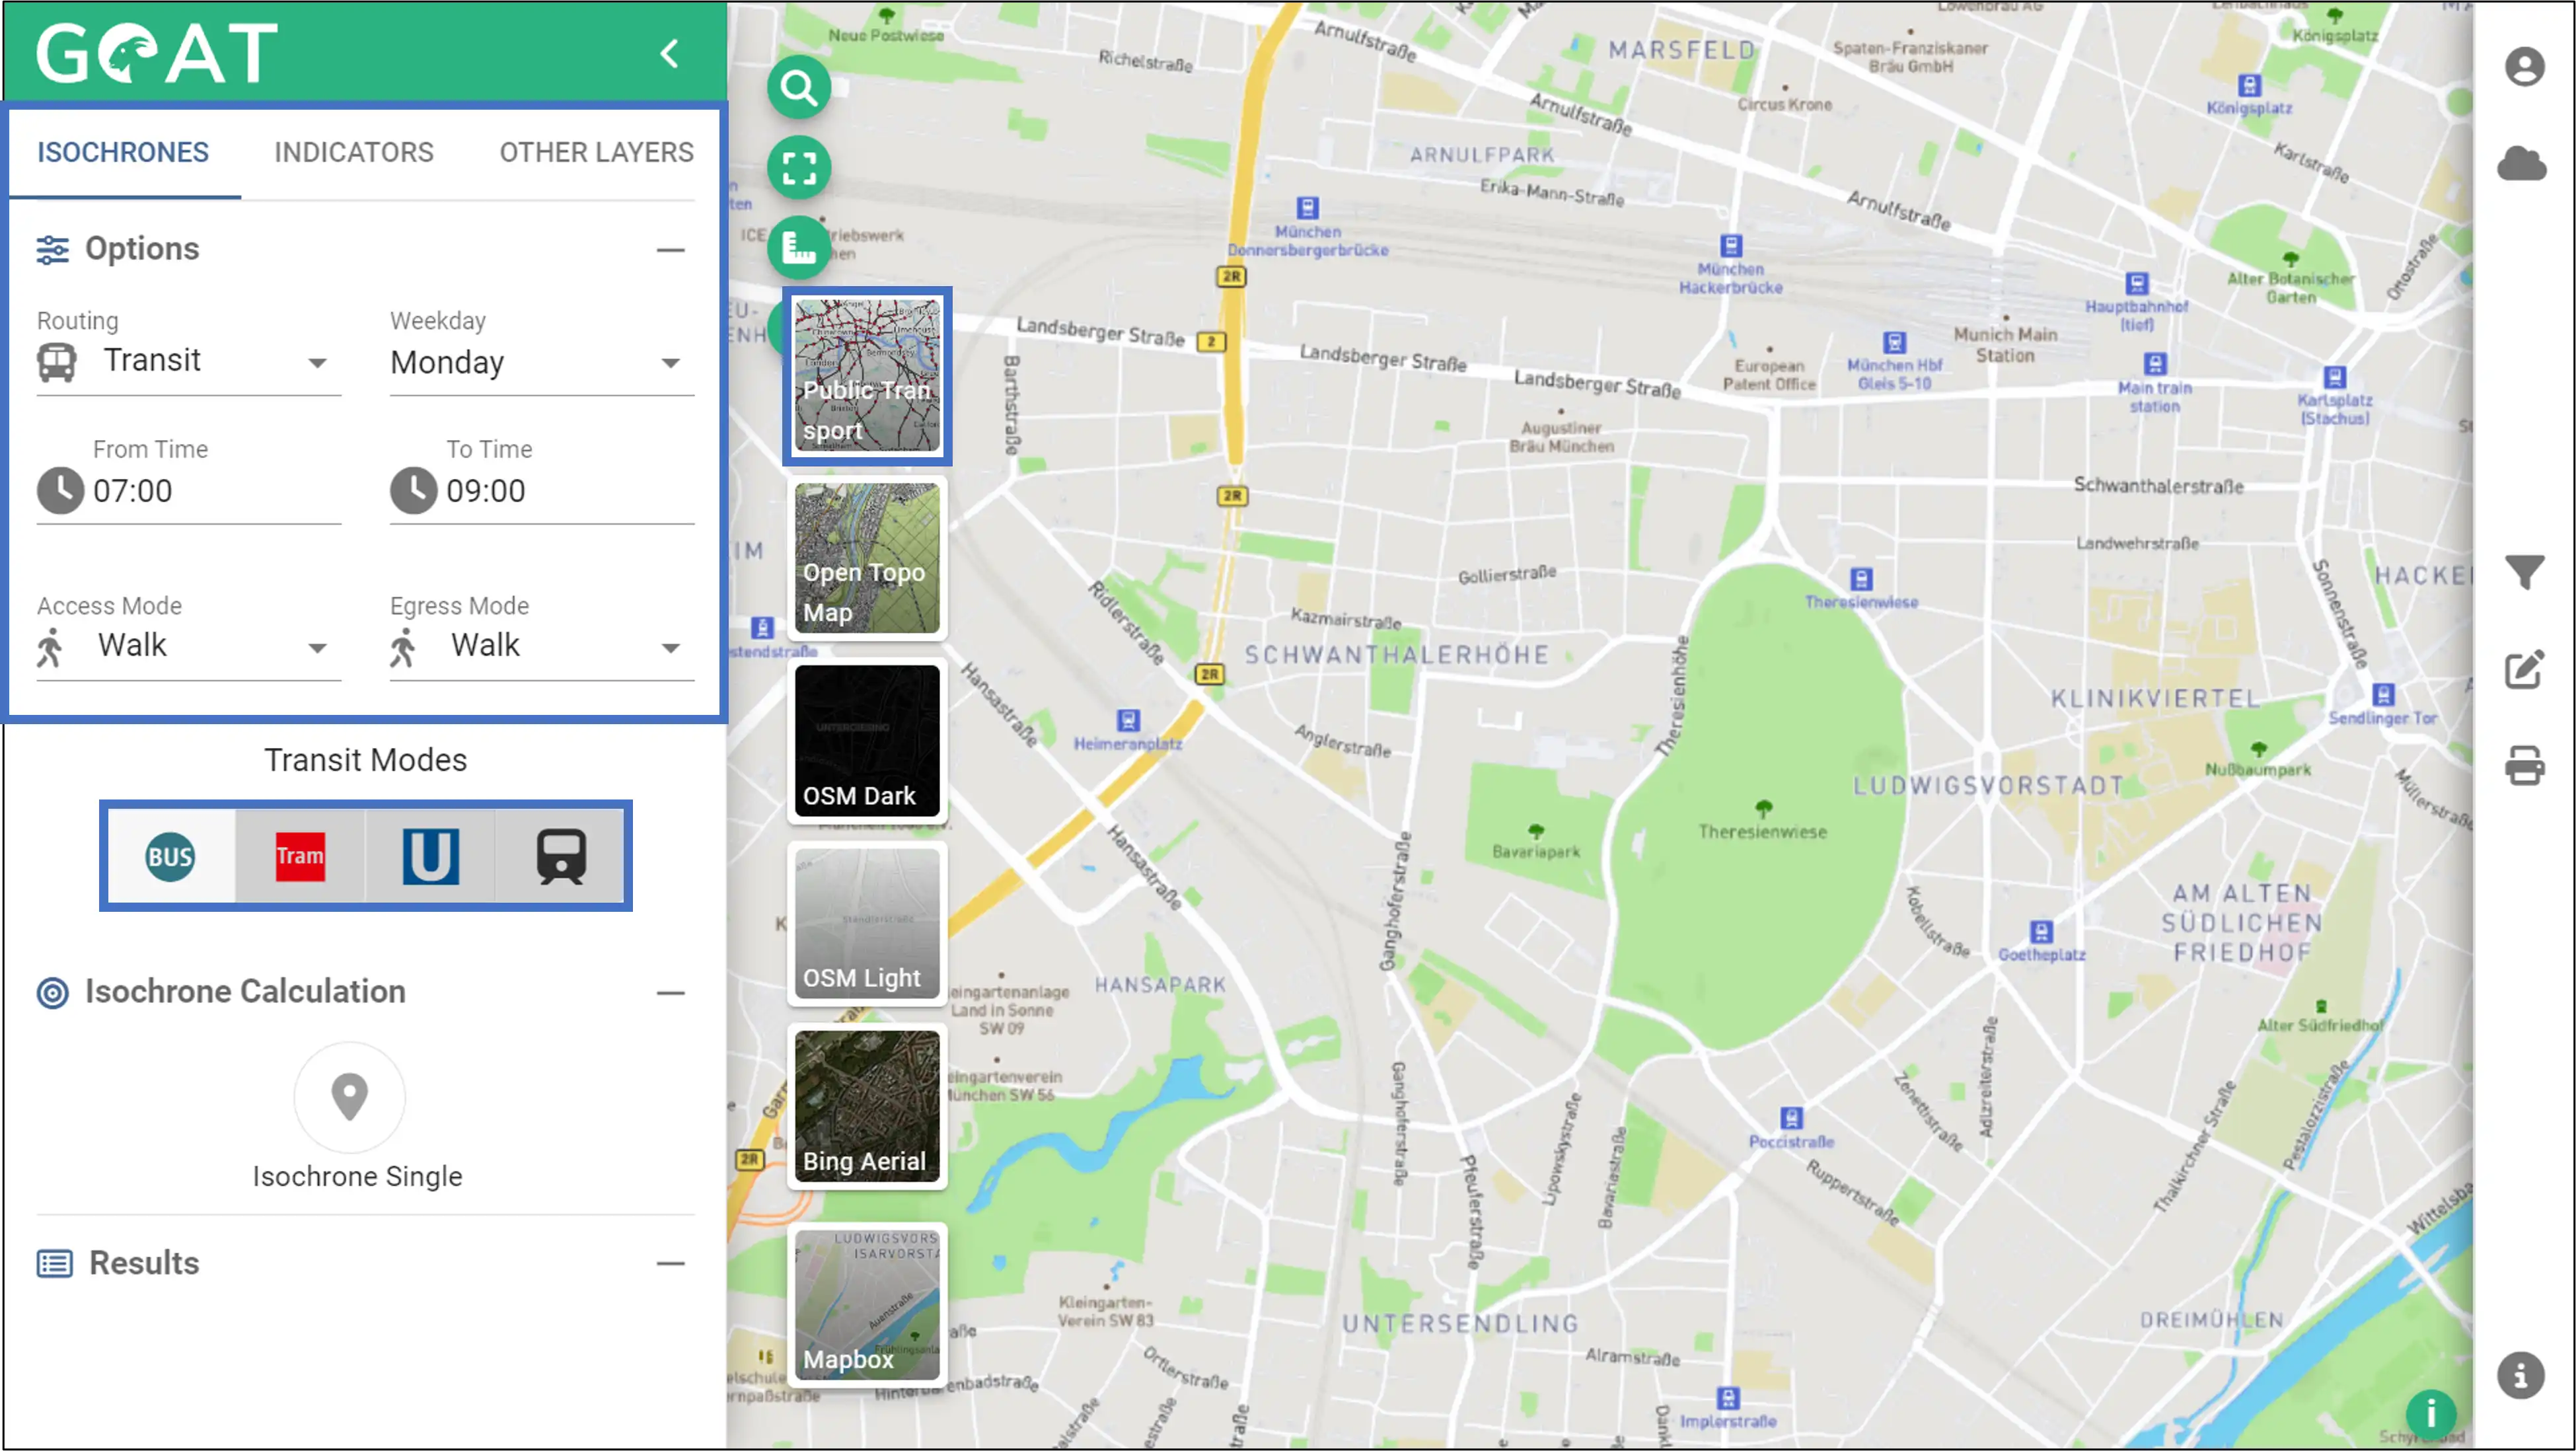
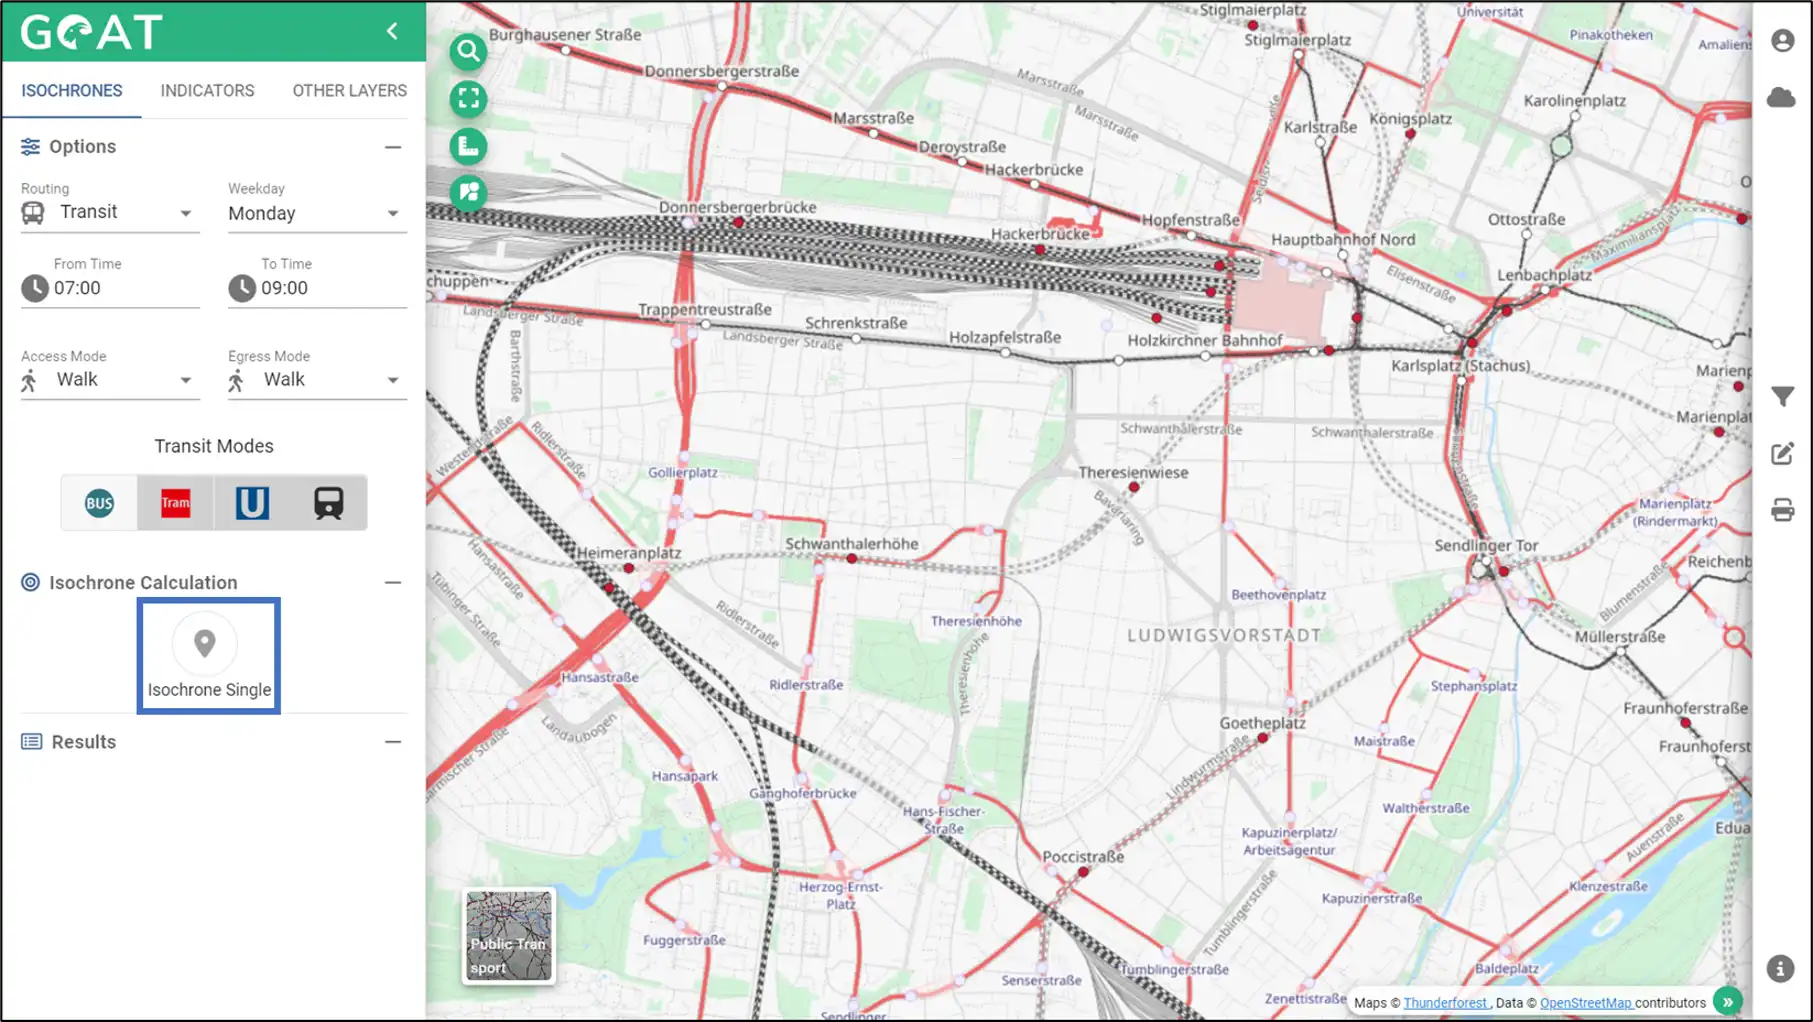
- Set the routing mode to “Transit” and choose the calculation options (weekday, time, access mode and egress mode) as desired. In the “Transit Modes” section, you can select which public transportation options shall be considered for the calculation. In this example, we focus on rail-based public transport (tram, underground and train). To get some additional information on the public transport network, you can activate the public transport background map.
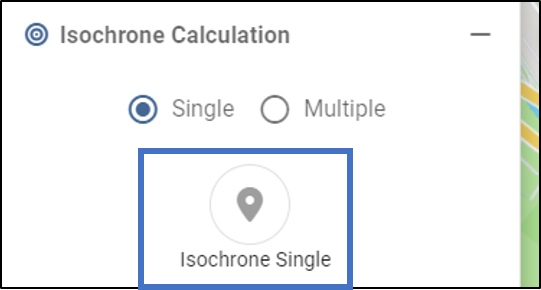
- Click “Isochrone Single” and zoom in the area where you want to calculate the isochrone.
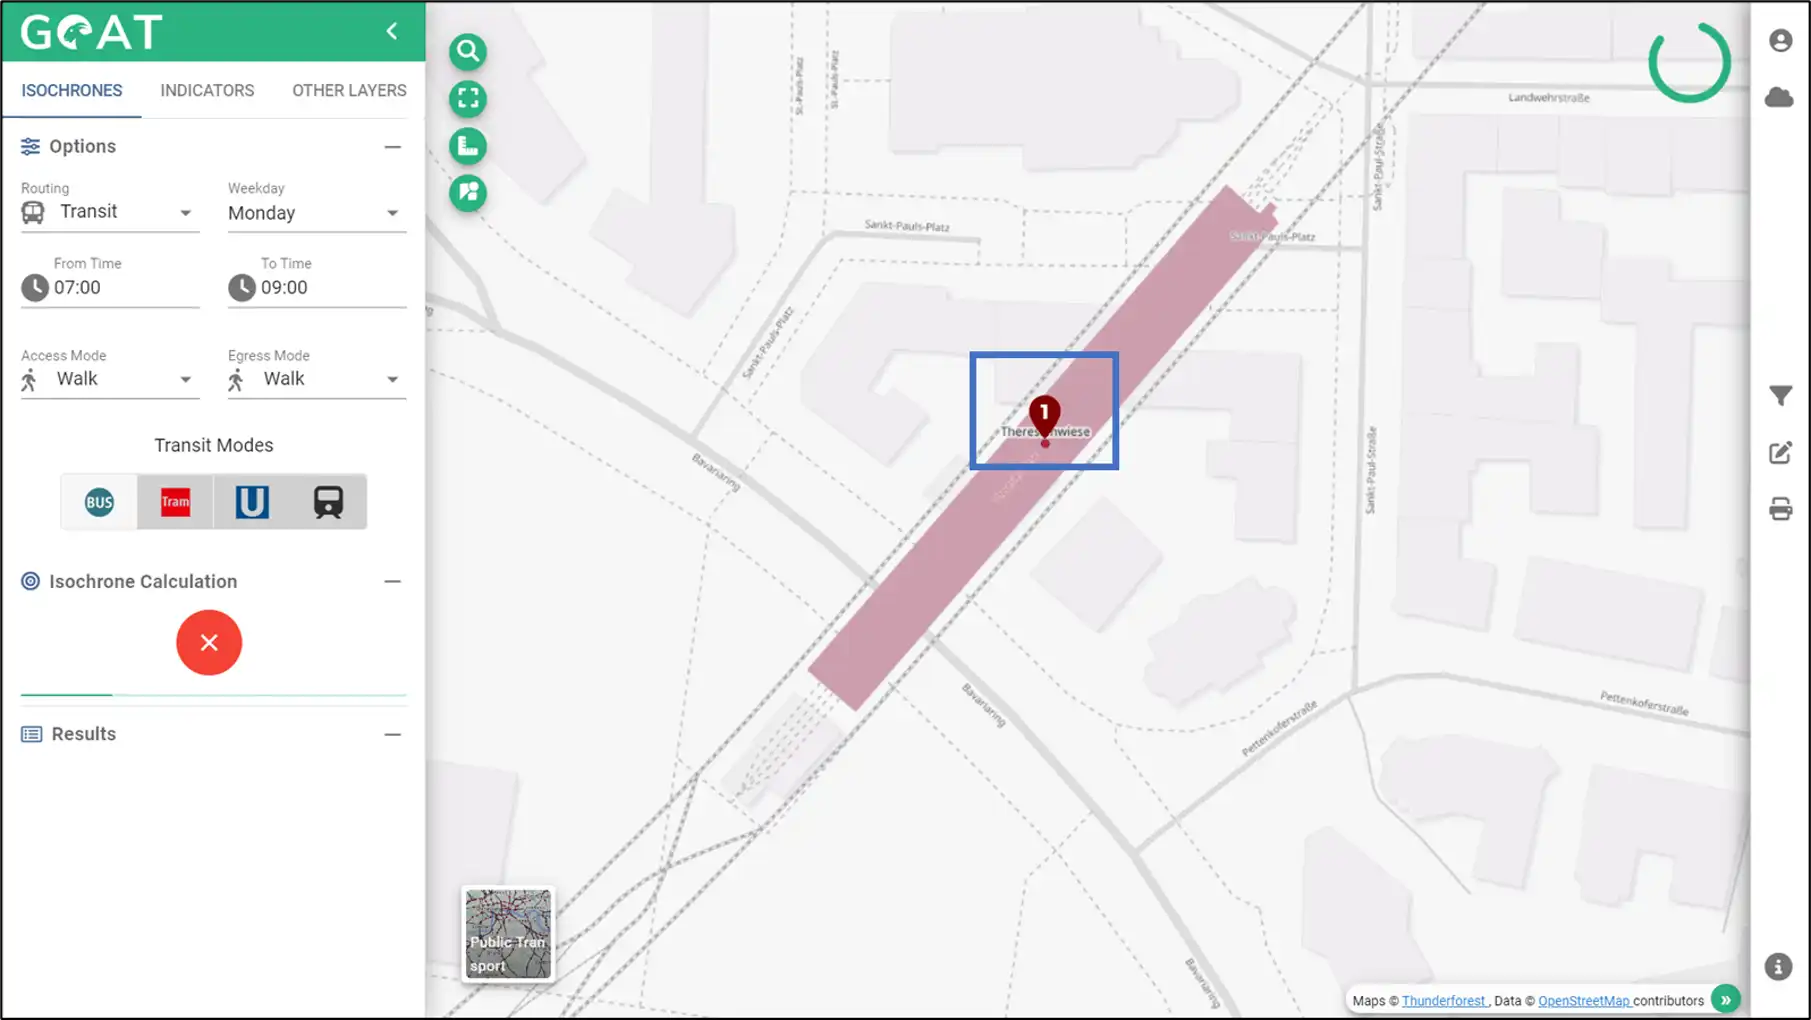
- Place the starting point for the isochrone.
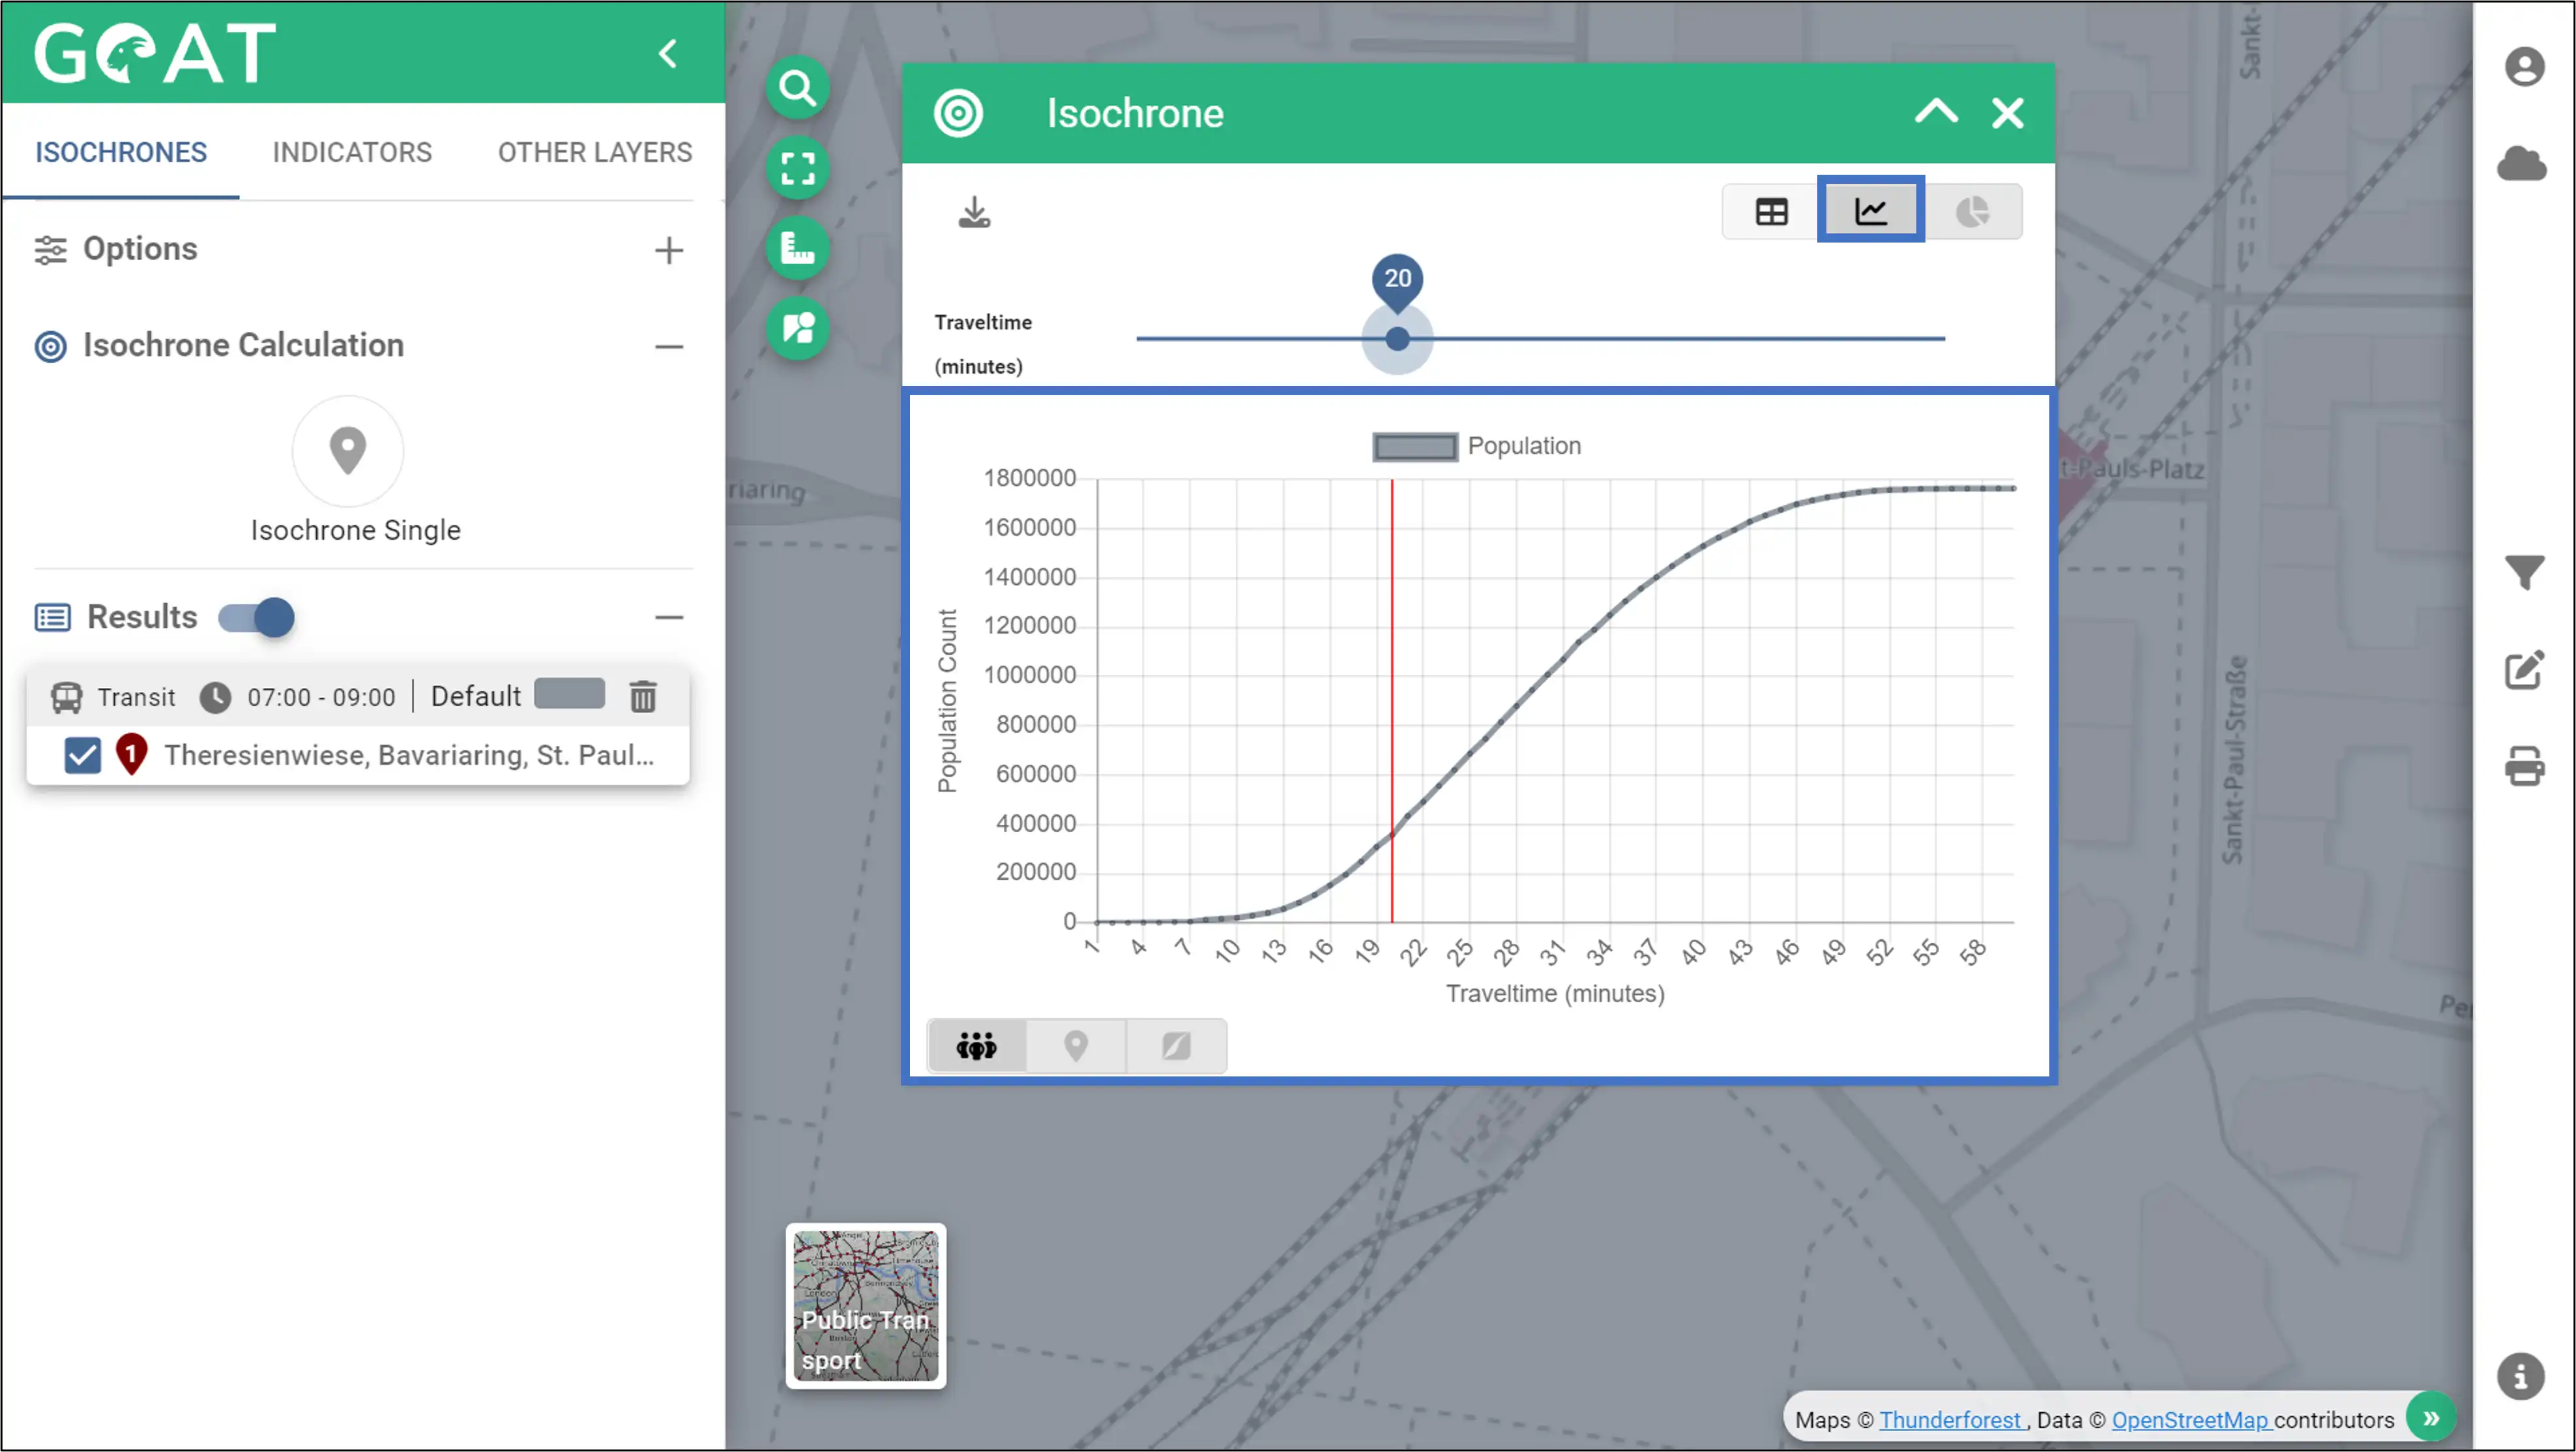
- After the calculation has been carried out, a window with the results opens automatically. From this window you can see how many people can access a specific location within 20min by rail-based public transport. You can also change the travel time by using the slider.
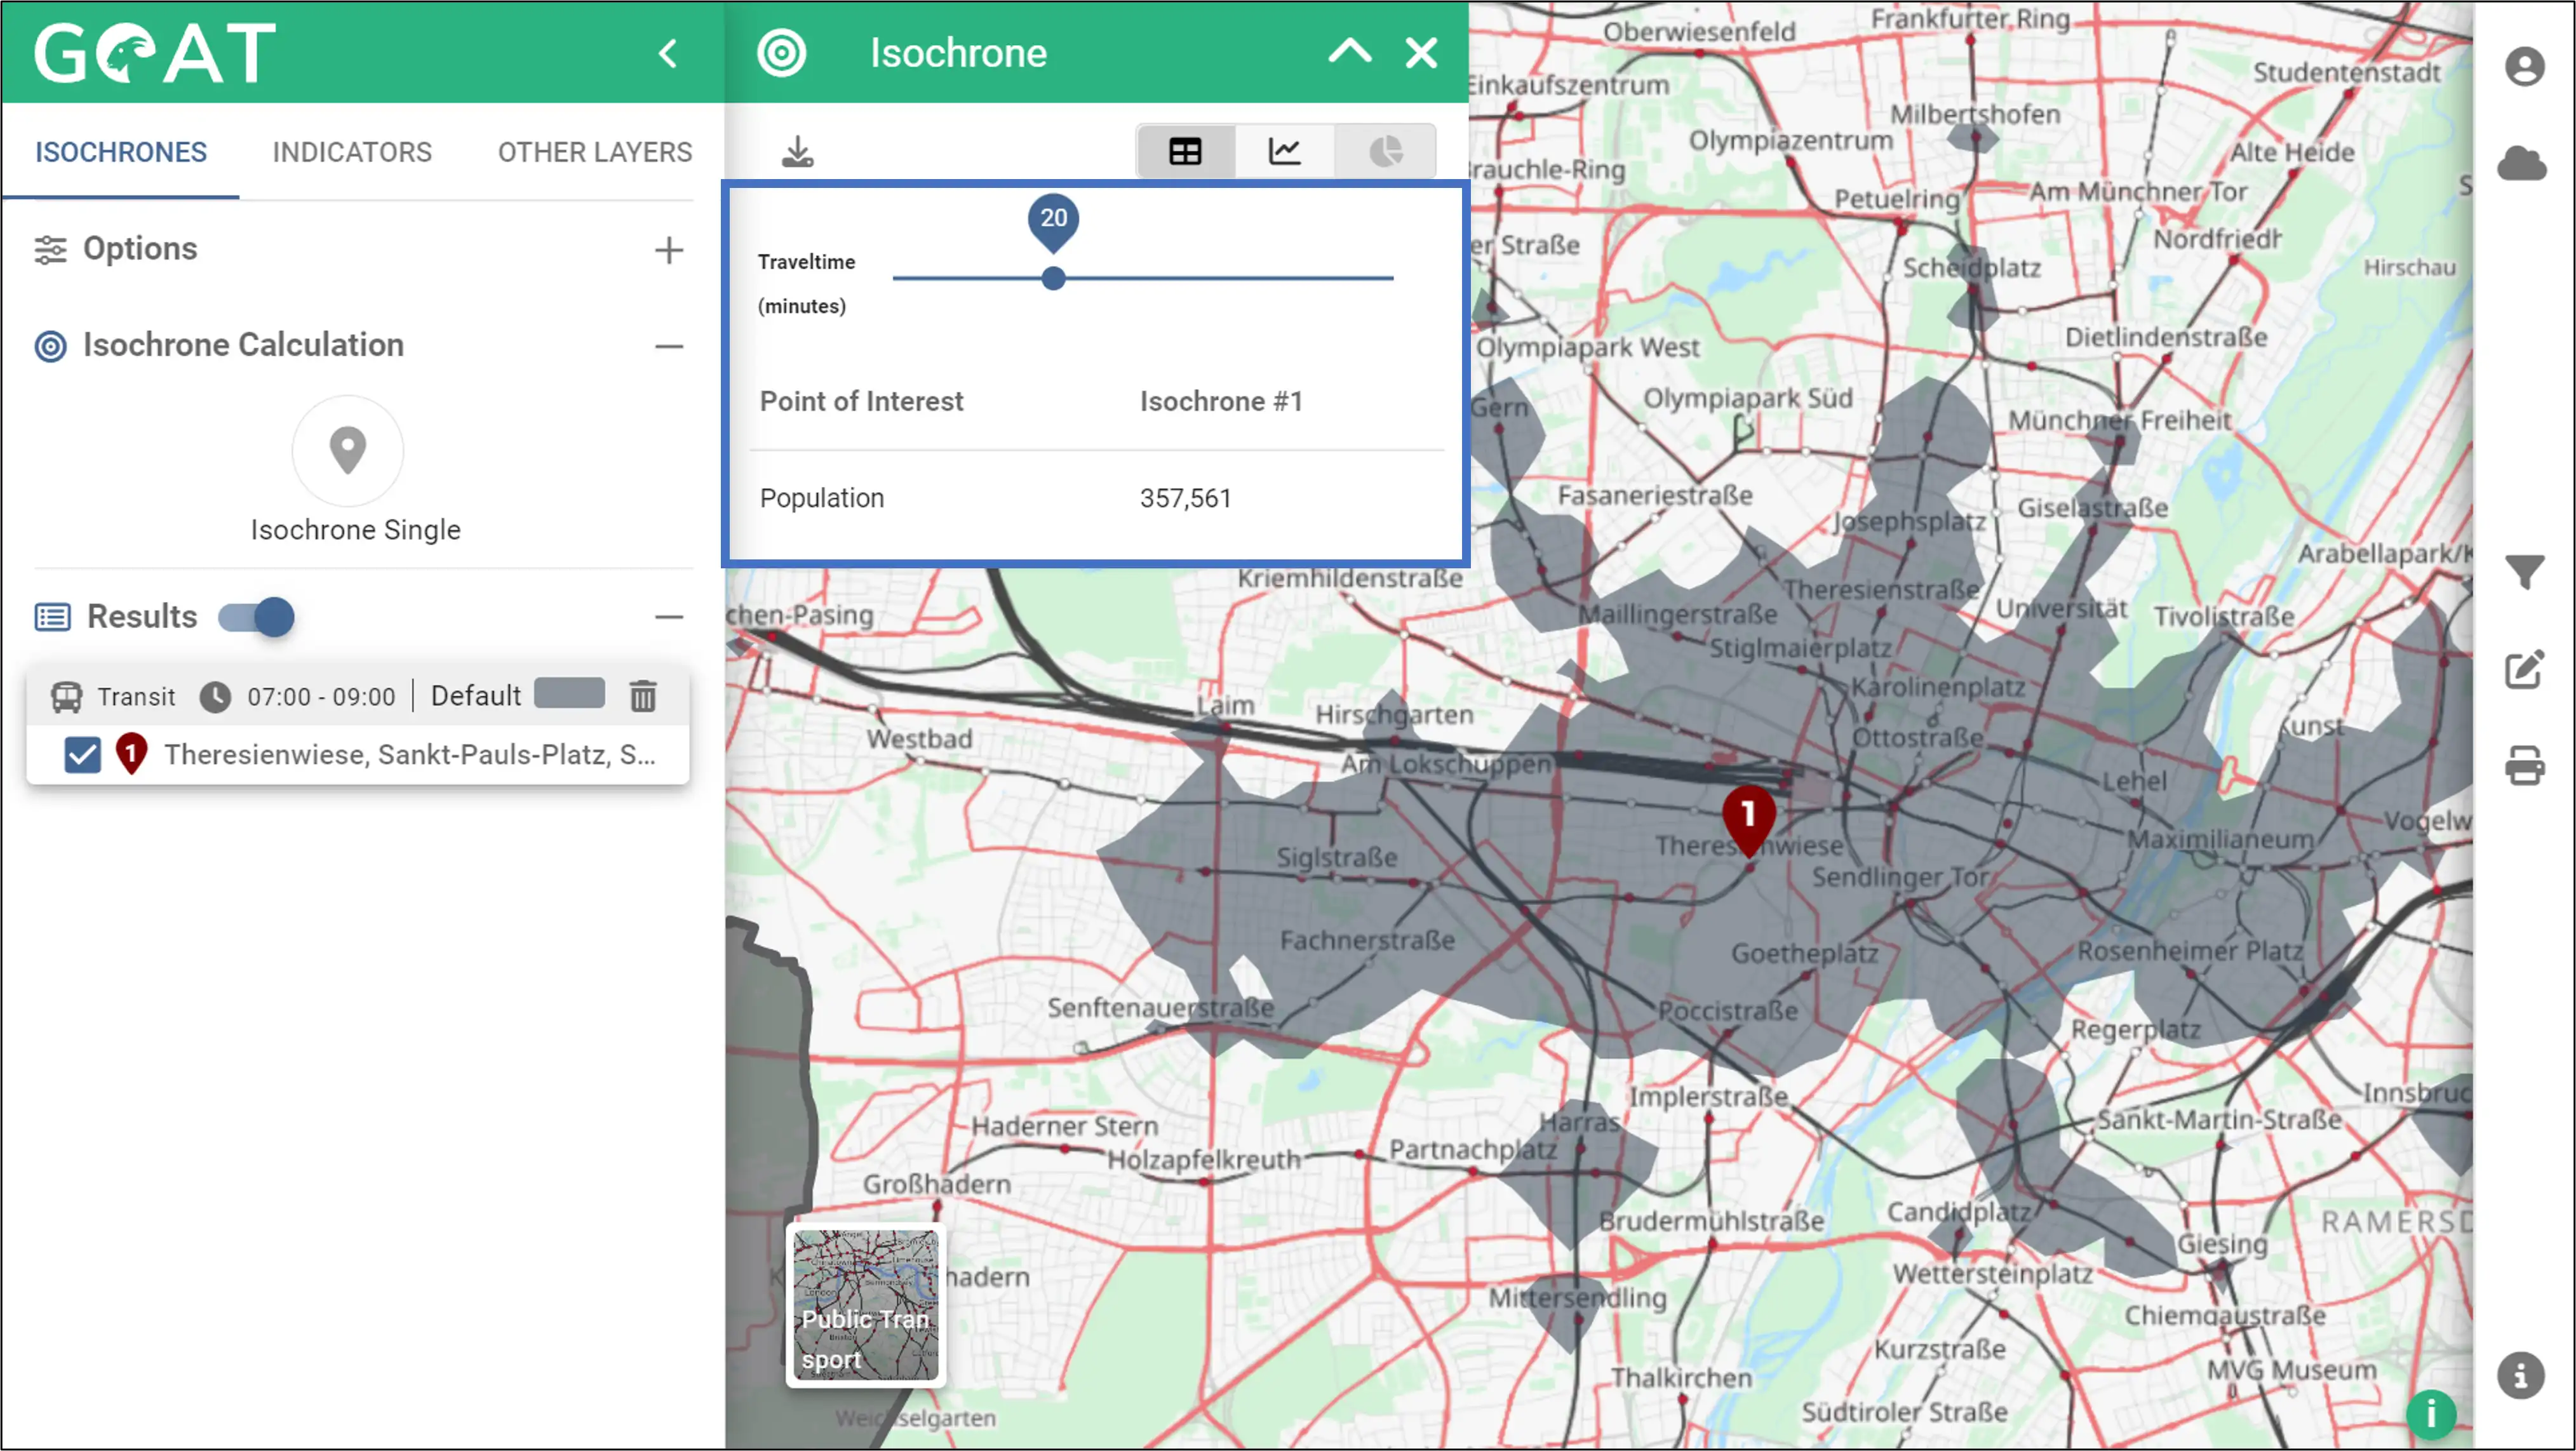
- You can also view the population graph with travel time by clicking the graph button indicated by the blue box.