Description of the feature
GOAT enables the calculation of multi-isochrones, which show how many residents from a certain neighbourhood have access to a facility (e.g. supermarket, kindergarten, public transport stop) in a certain travel time. The significant difference between multi-isochrones and single-isochrones is that multi-isochrones allow you to choose several starting points and compute the catchment areas for all of them at once.
Possible use cases (planning questions)
- How well are the supermarkets currently distributed over the city? In which districts do you have accessibility deficits?
- How many inhabitants can reach a public transport stop by bicycle in a given travel time?
Video Tutorial
Step-by-step tutorial for an exemplary planning task
1 Accessibility to supermarkets
1.1 Planning question
How well are the supermarkets currently distributed over the city? In which districts do you have accessibility deficits?
1.2 Step-by-Step guide
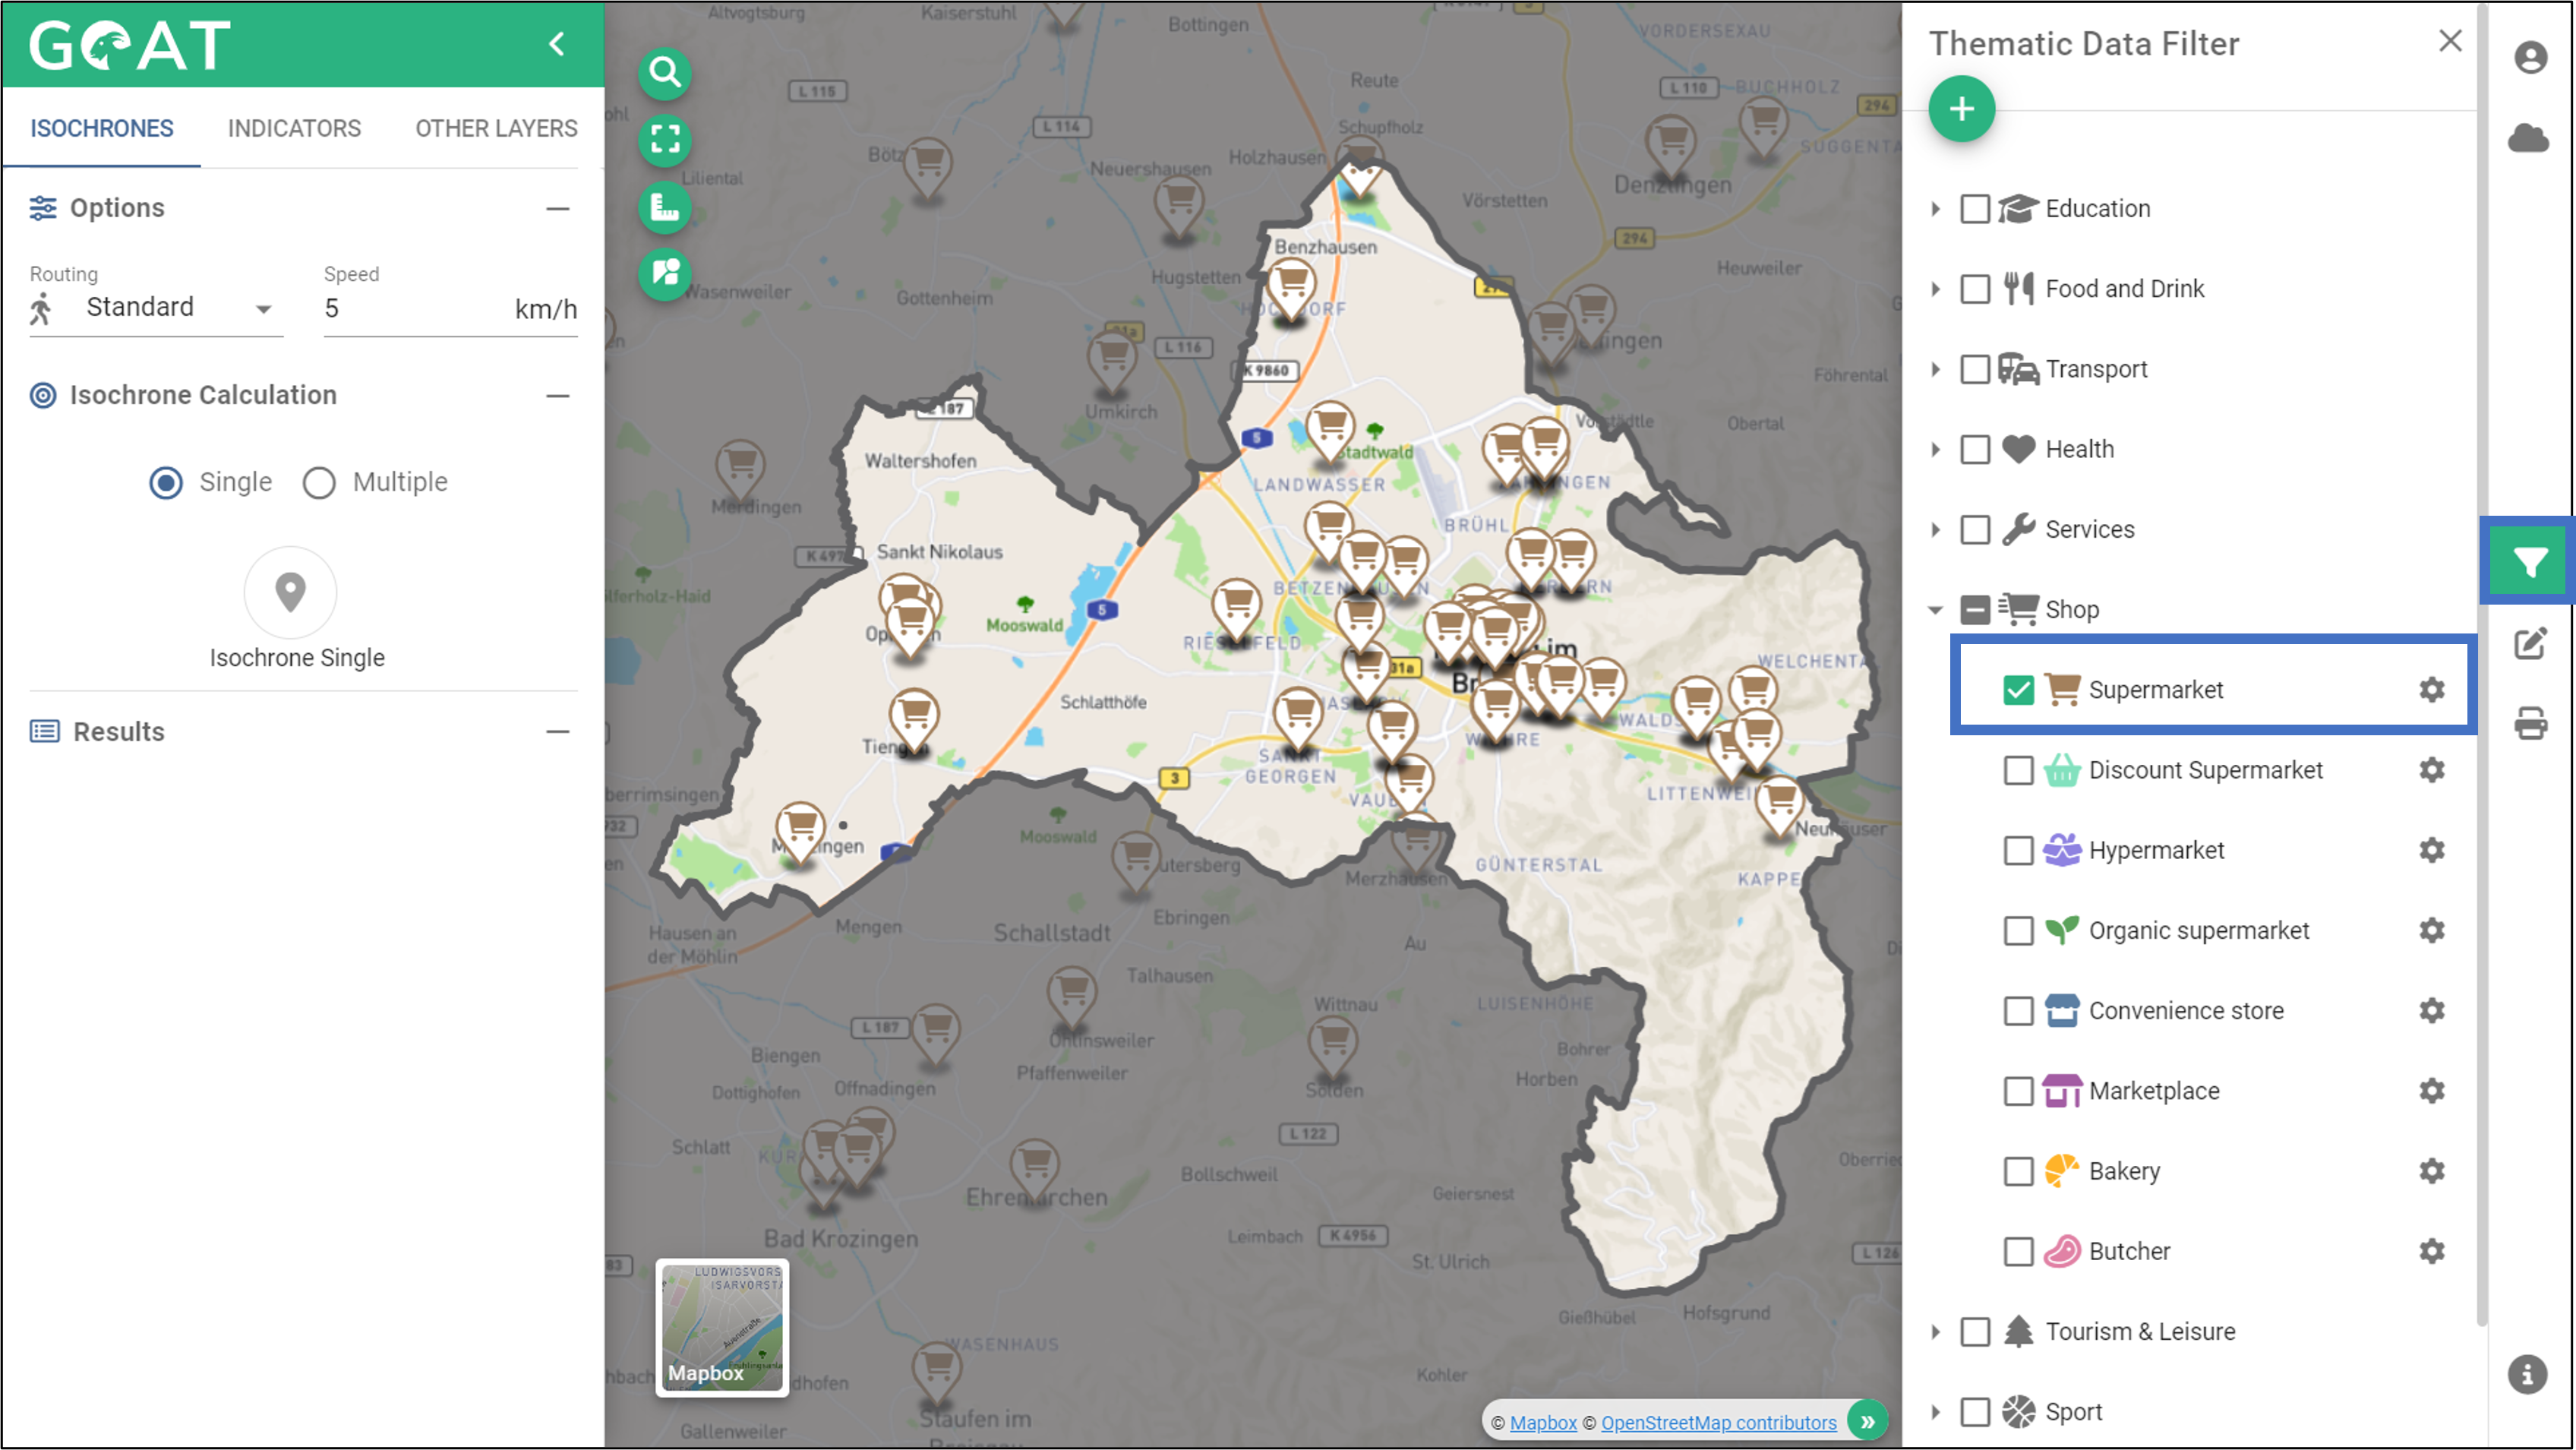
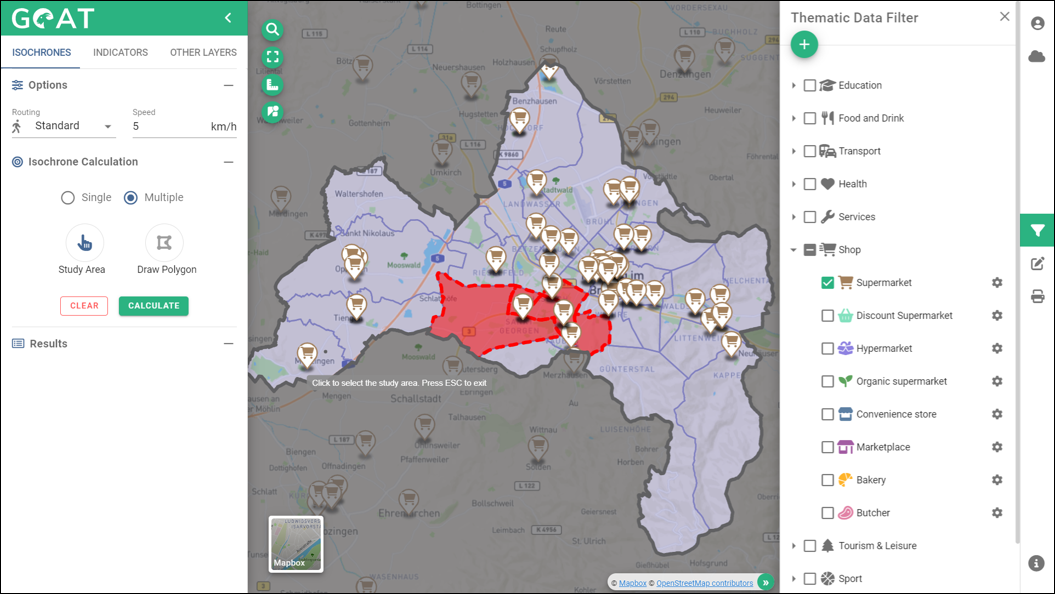
- Display the supermarkets as thematic data (can be found in the “shop” category).
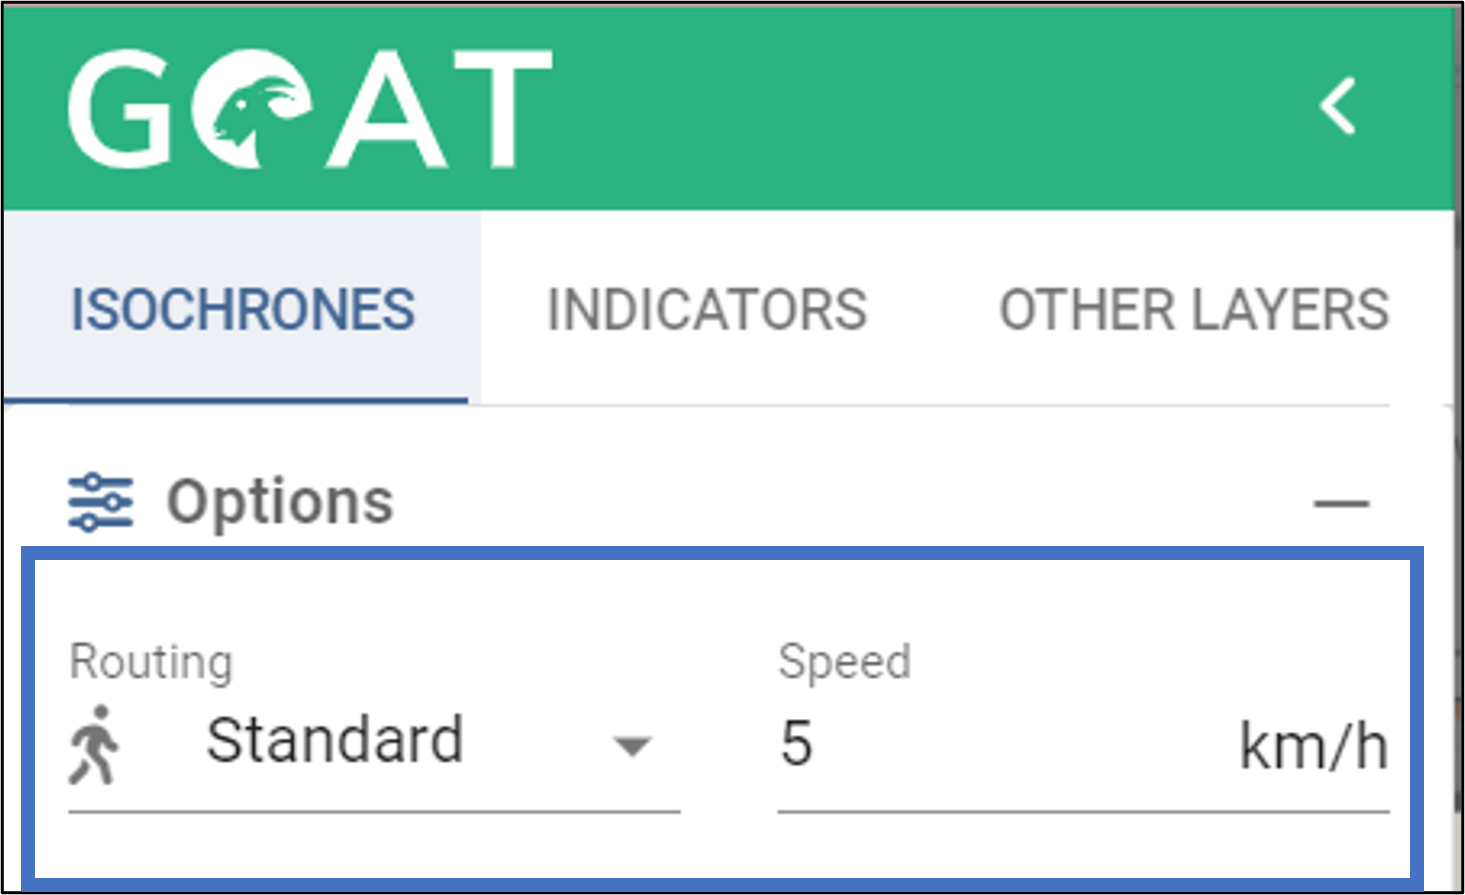
- Set the routing options as desired (e.g. walking, 5km/h, 10 min travel time, 2 isochrones).
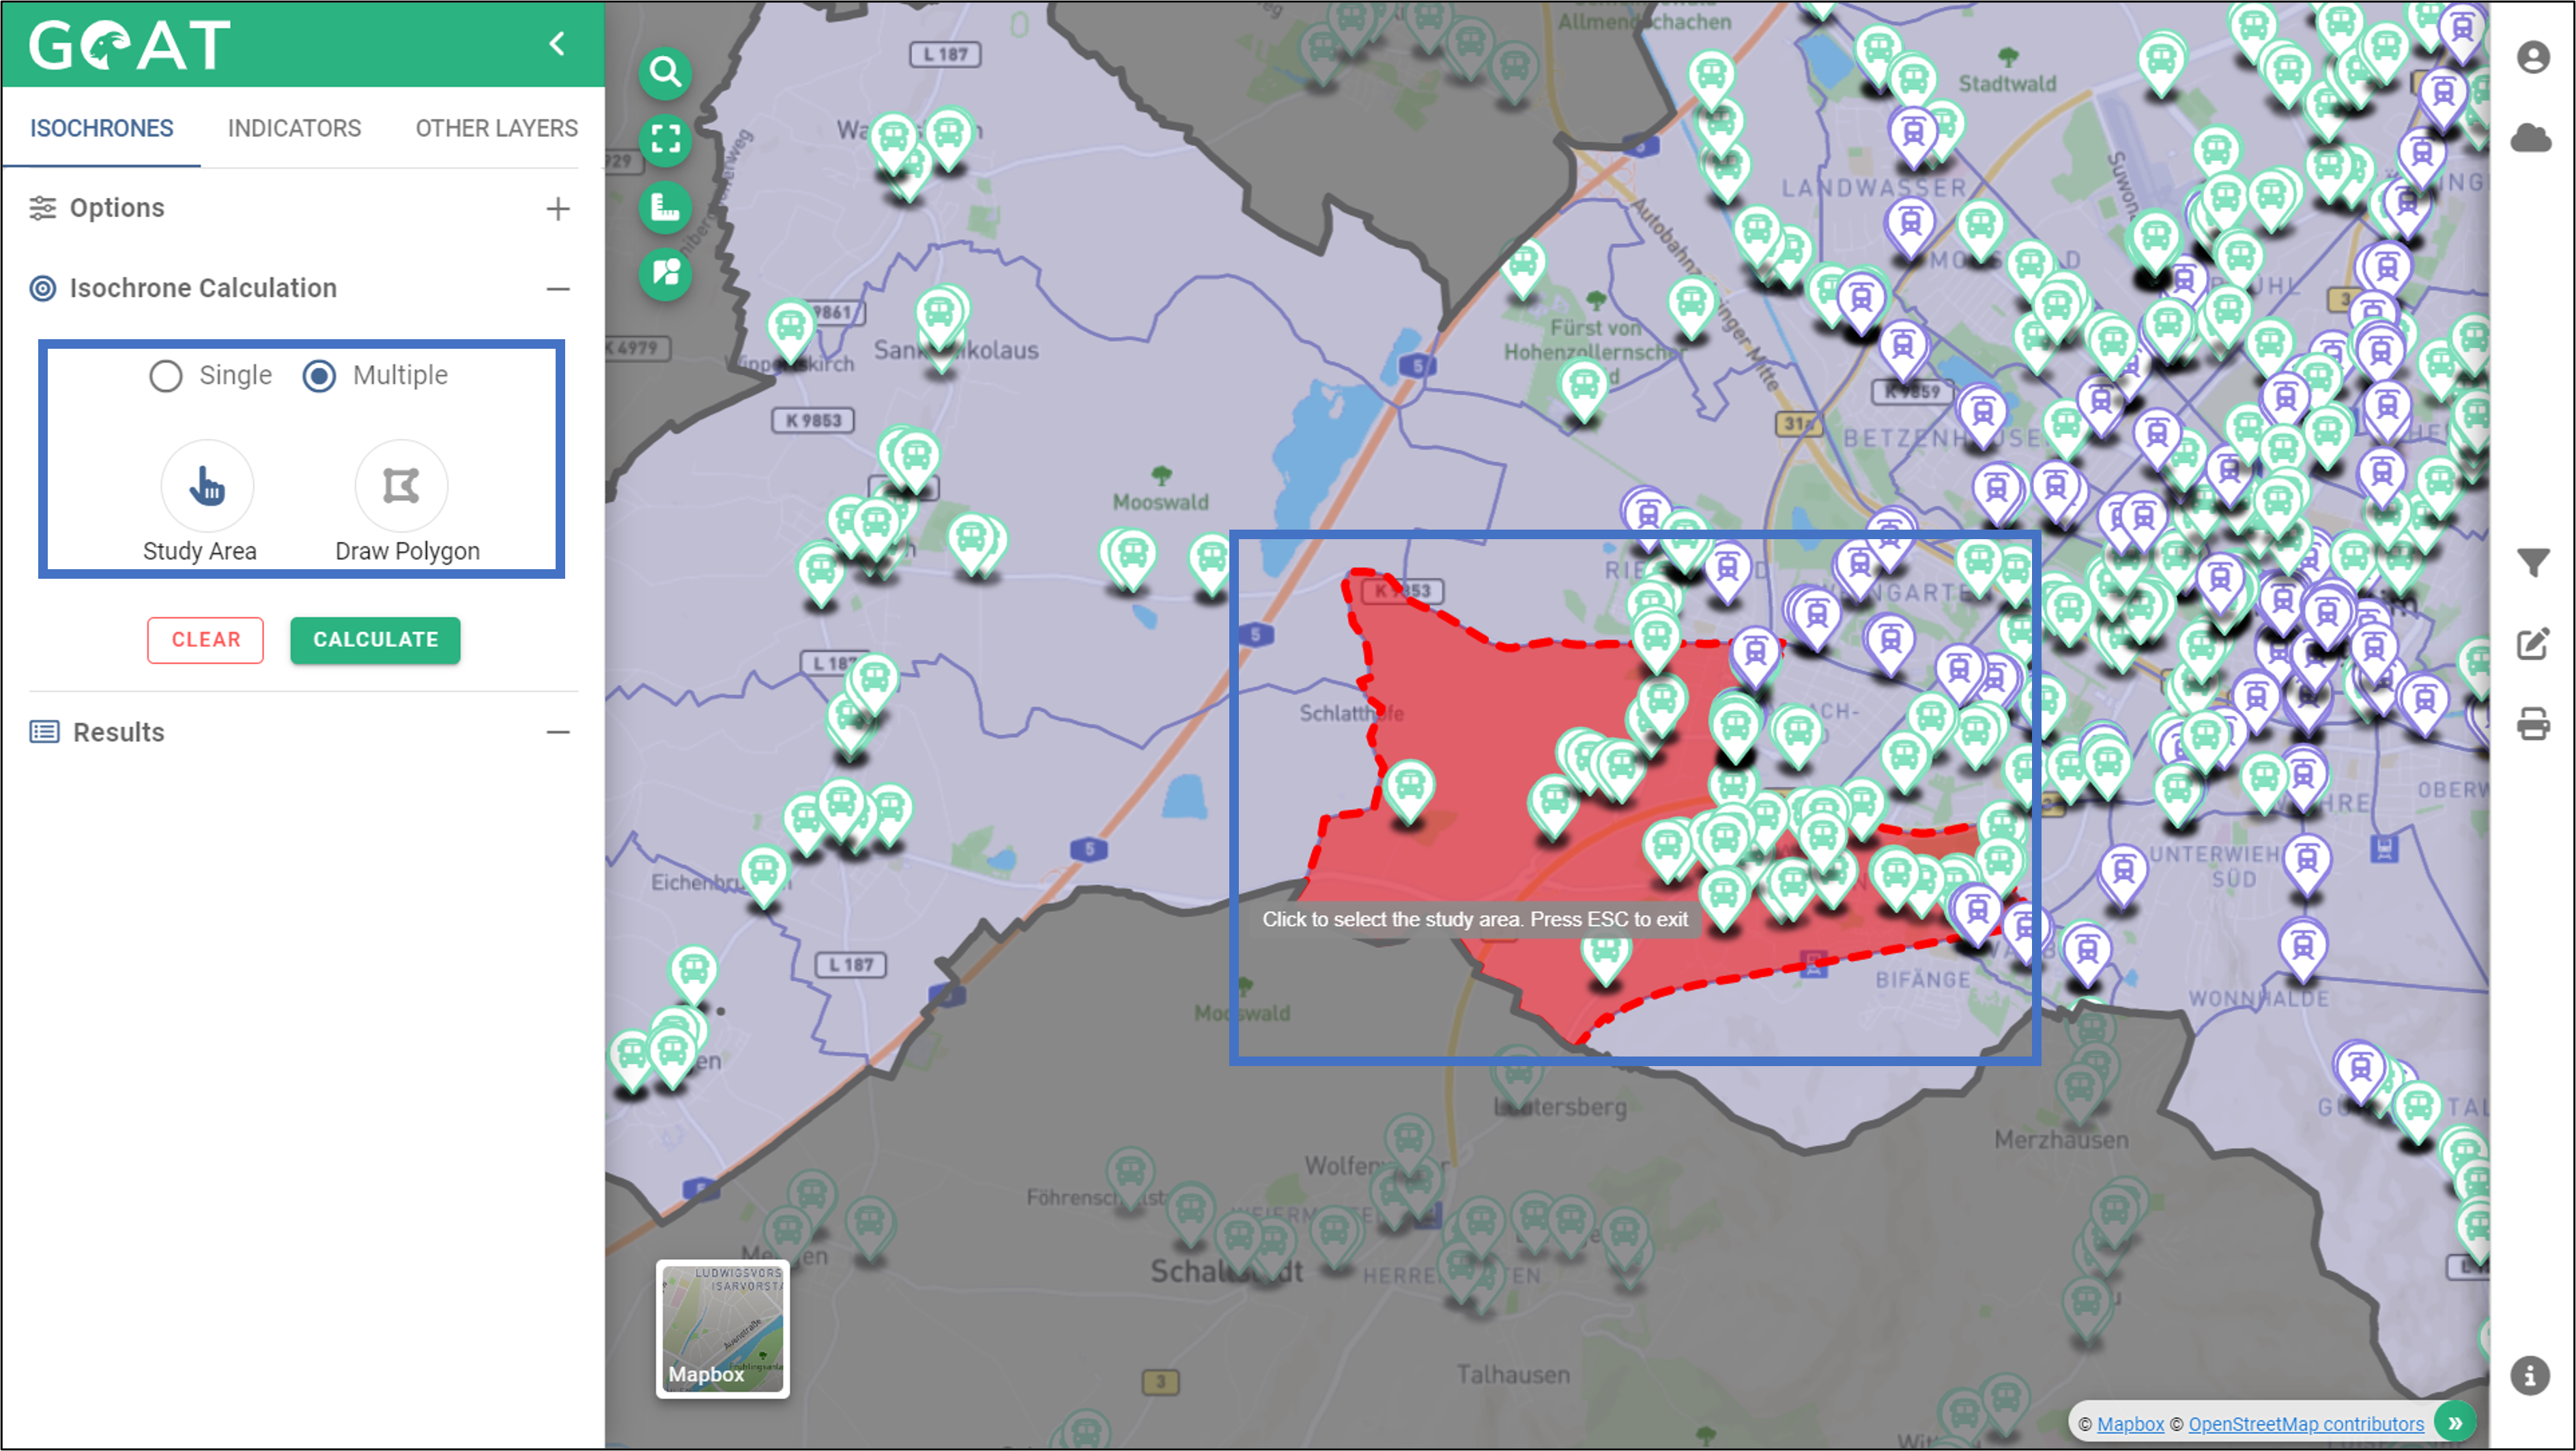
- Switch to the “Multiple” isochrone calculation mode and select the “Study Area” method, which later lists all results differentiated by districts.
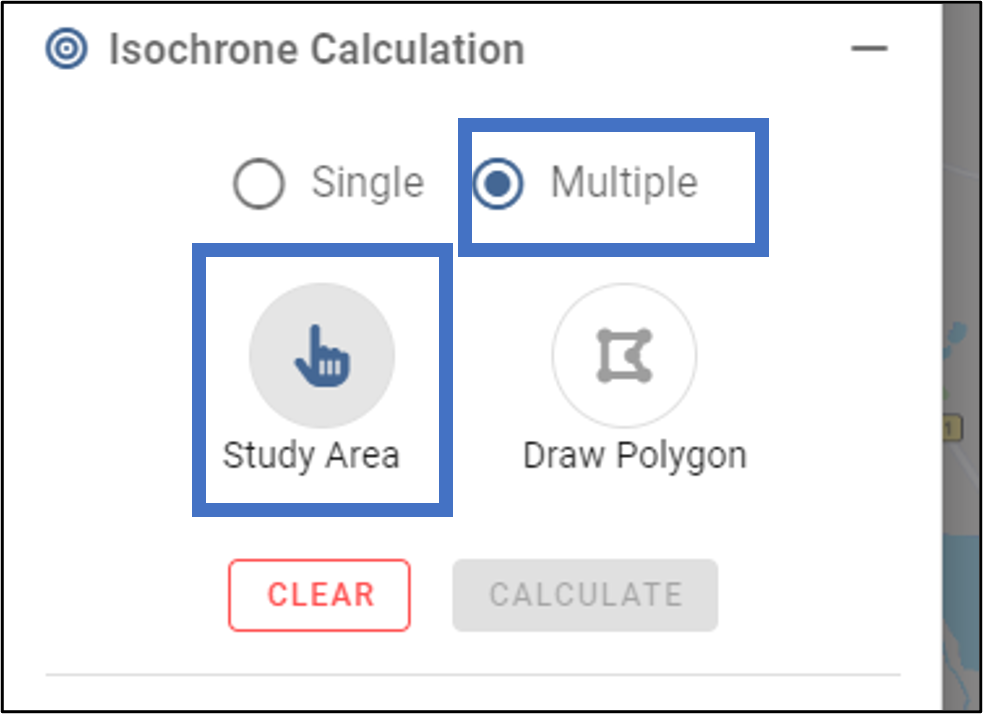
- Then select all districts that you want to include in the calculation by clicking on the map.
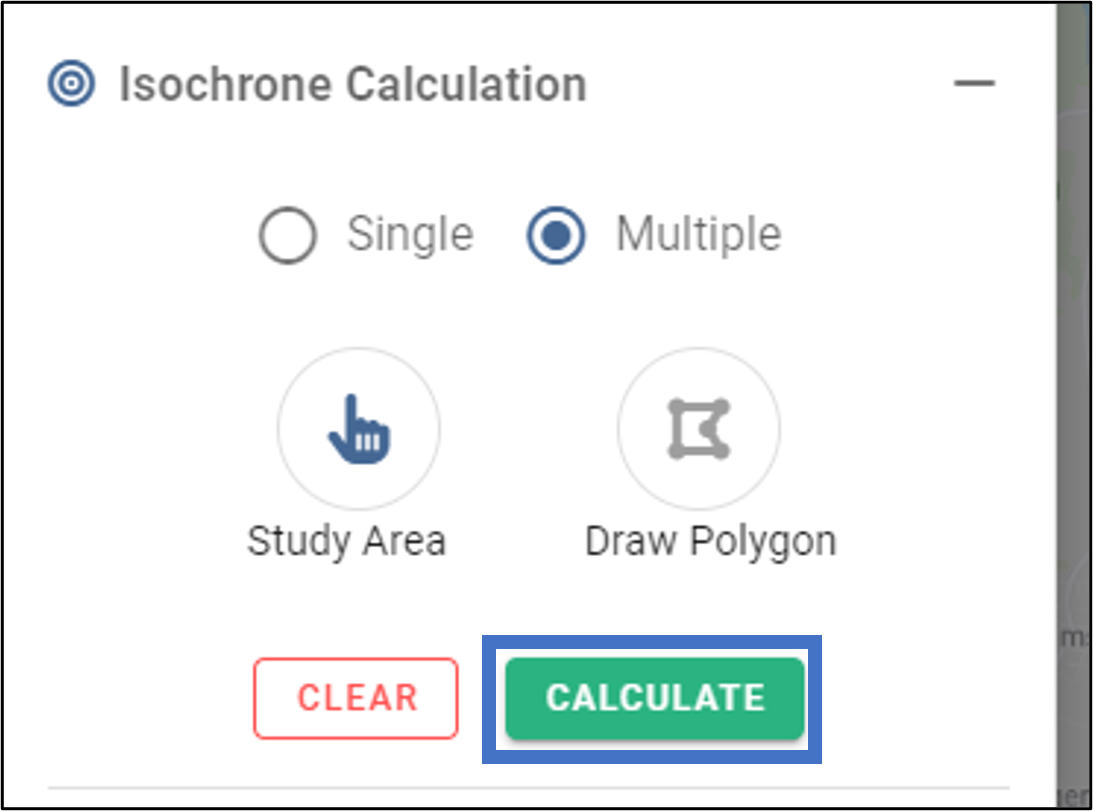
- Click on “Calculate.”
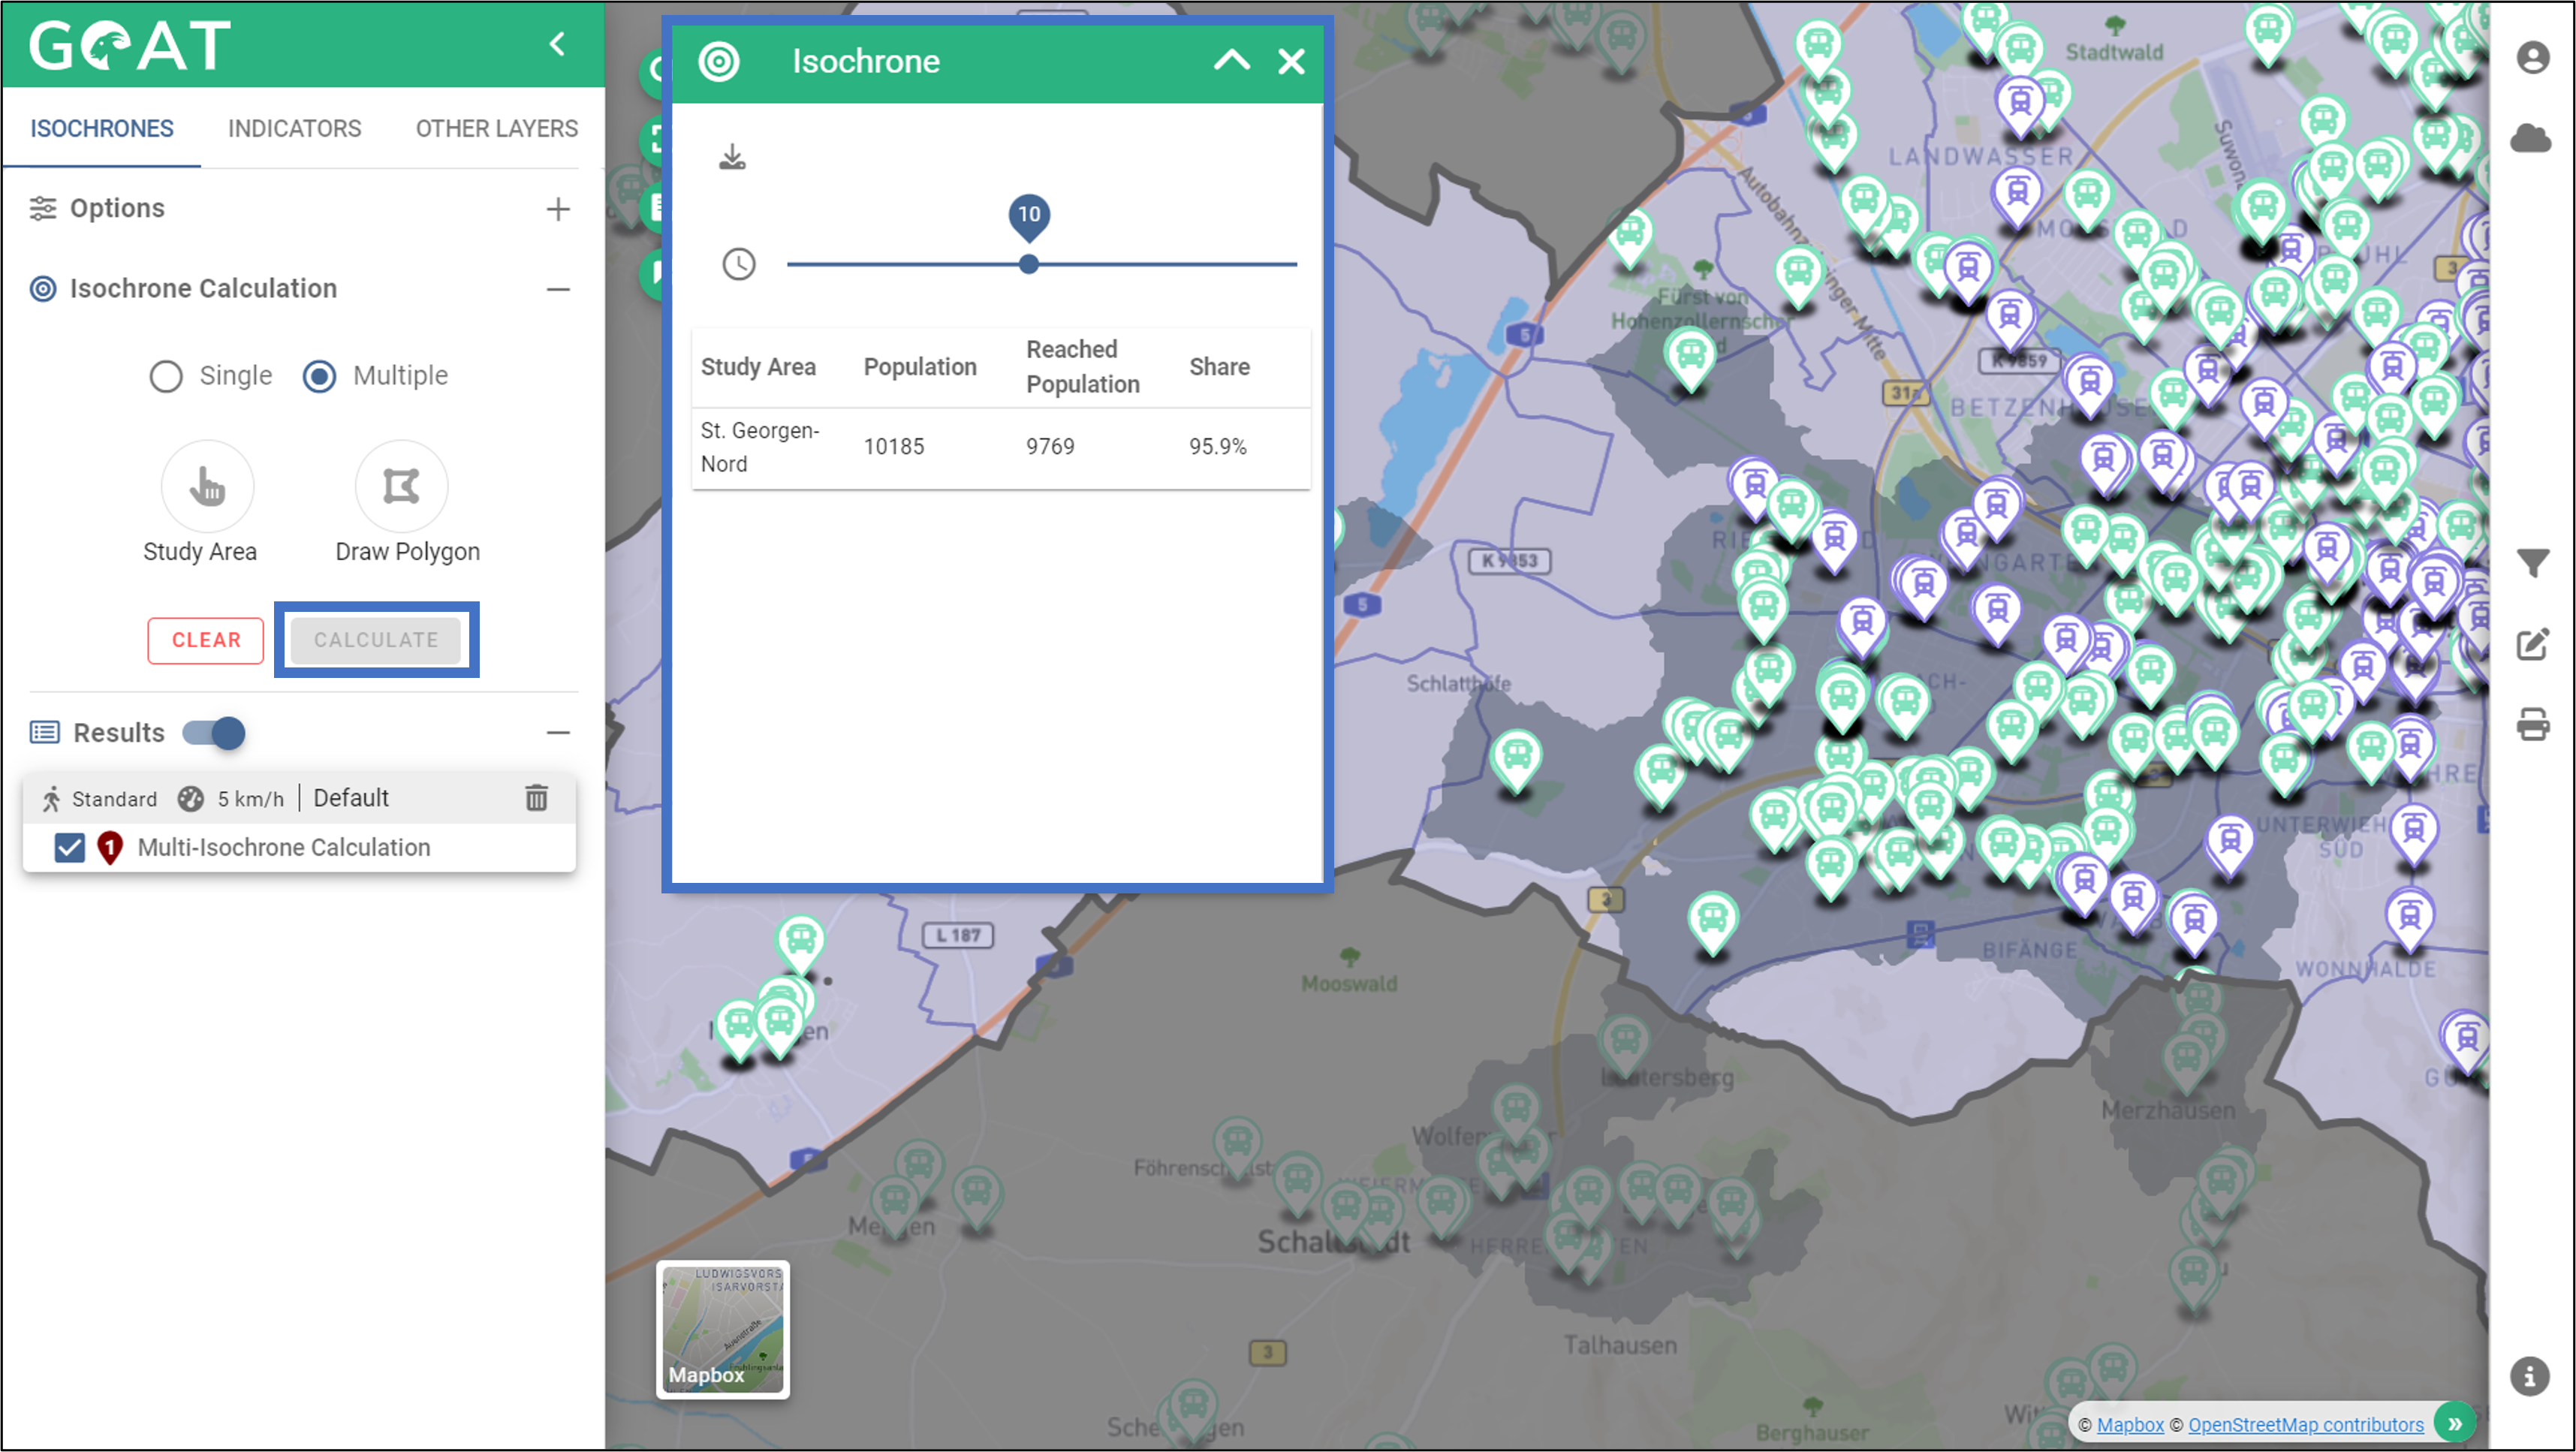
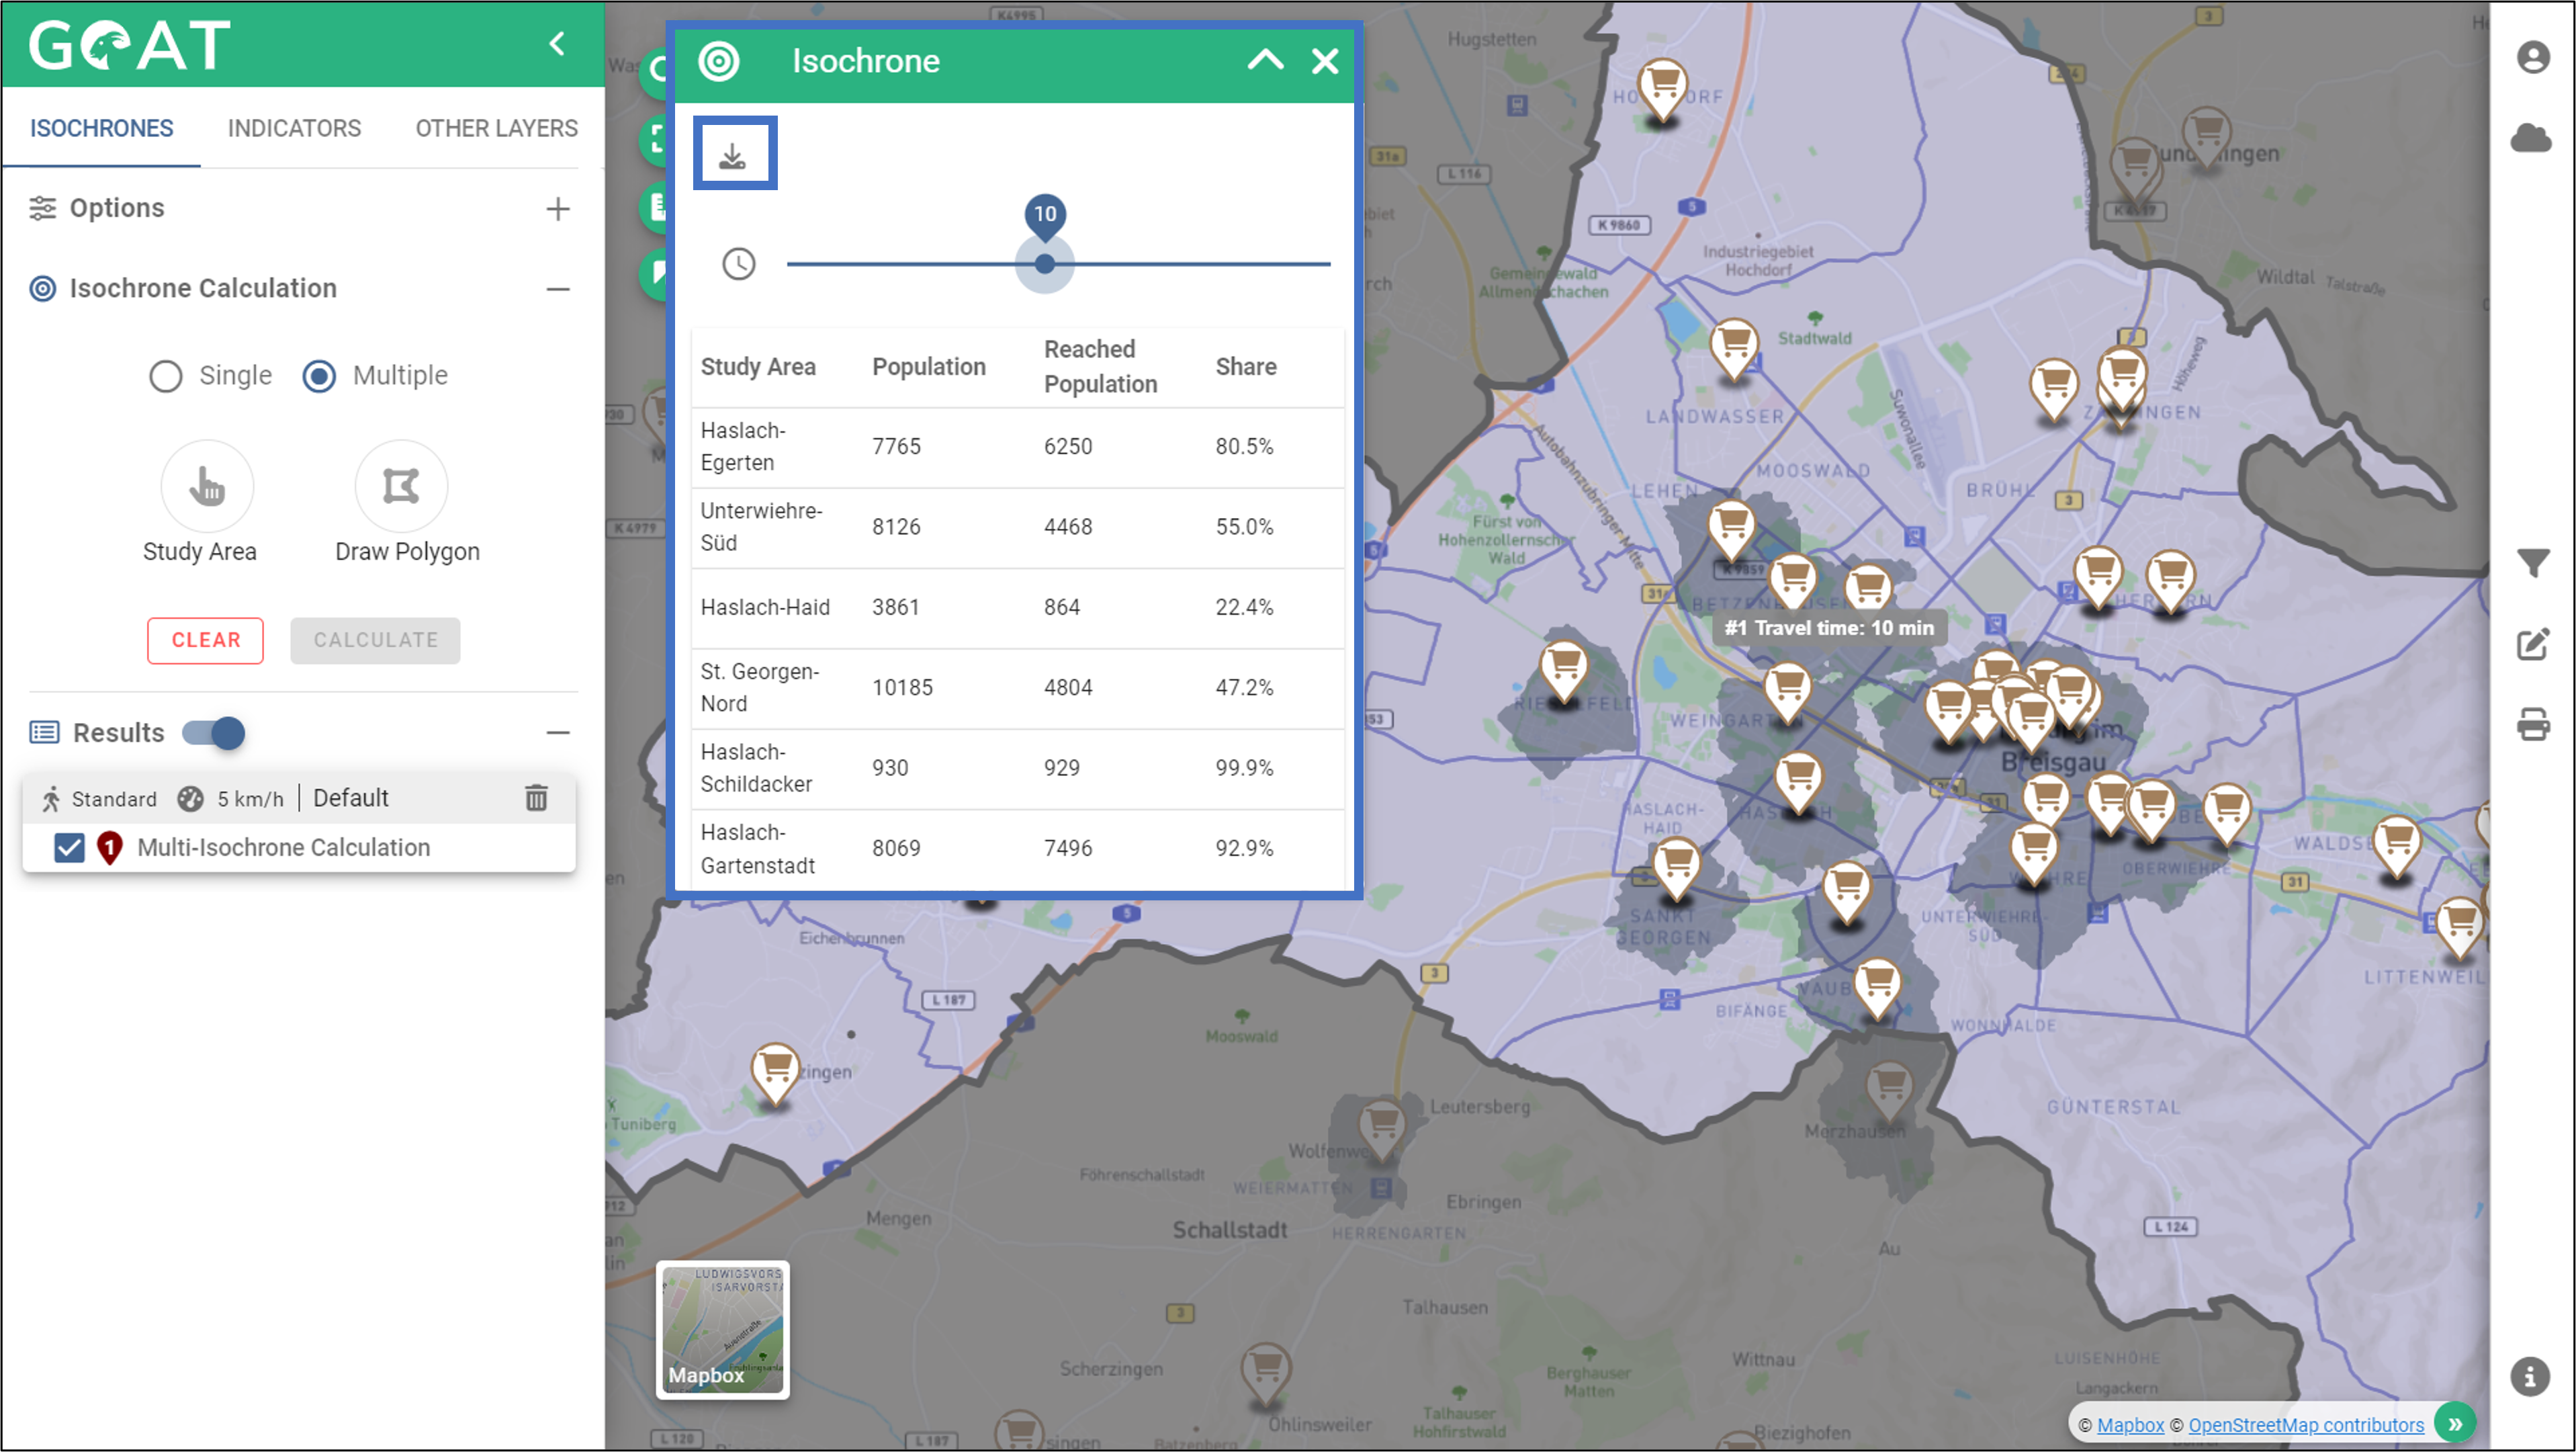
- The resulting multi-isochrones shows the catchment areas of the supermarkets (here for the mode “pedestrian” with 10 minutes catchment area). The corresponding table shows, sorted by district, how many people out of the total population can reach a supermarket in 10 minutes walking distance. Via the “download” button you can download the results.
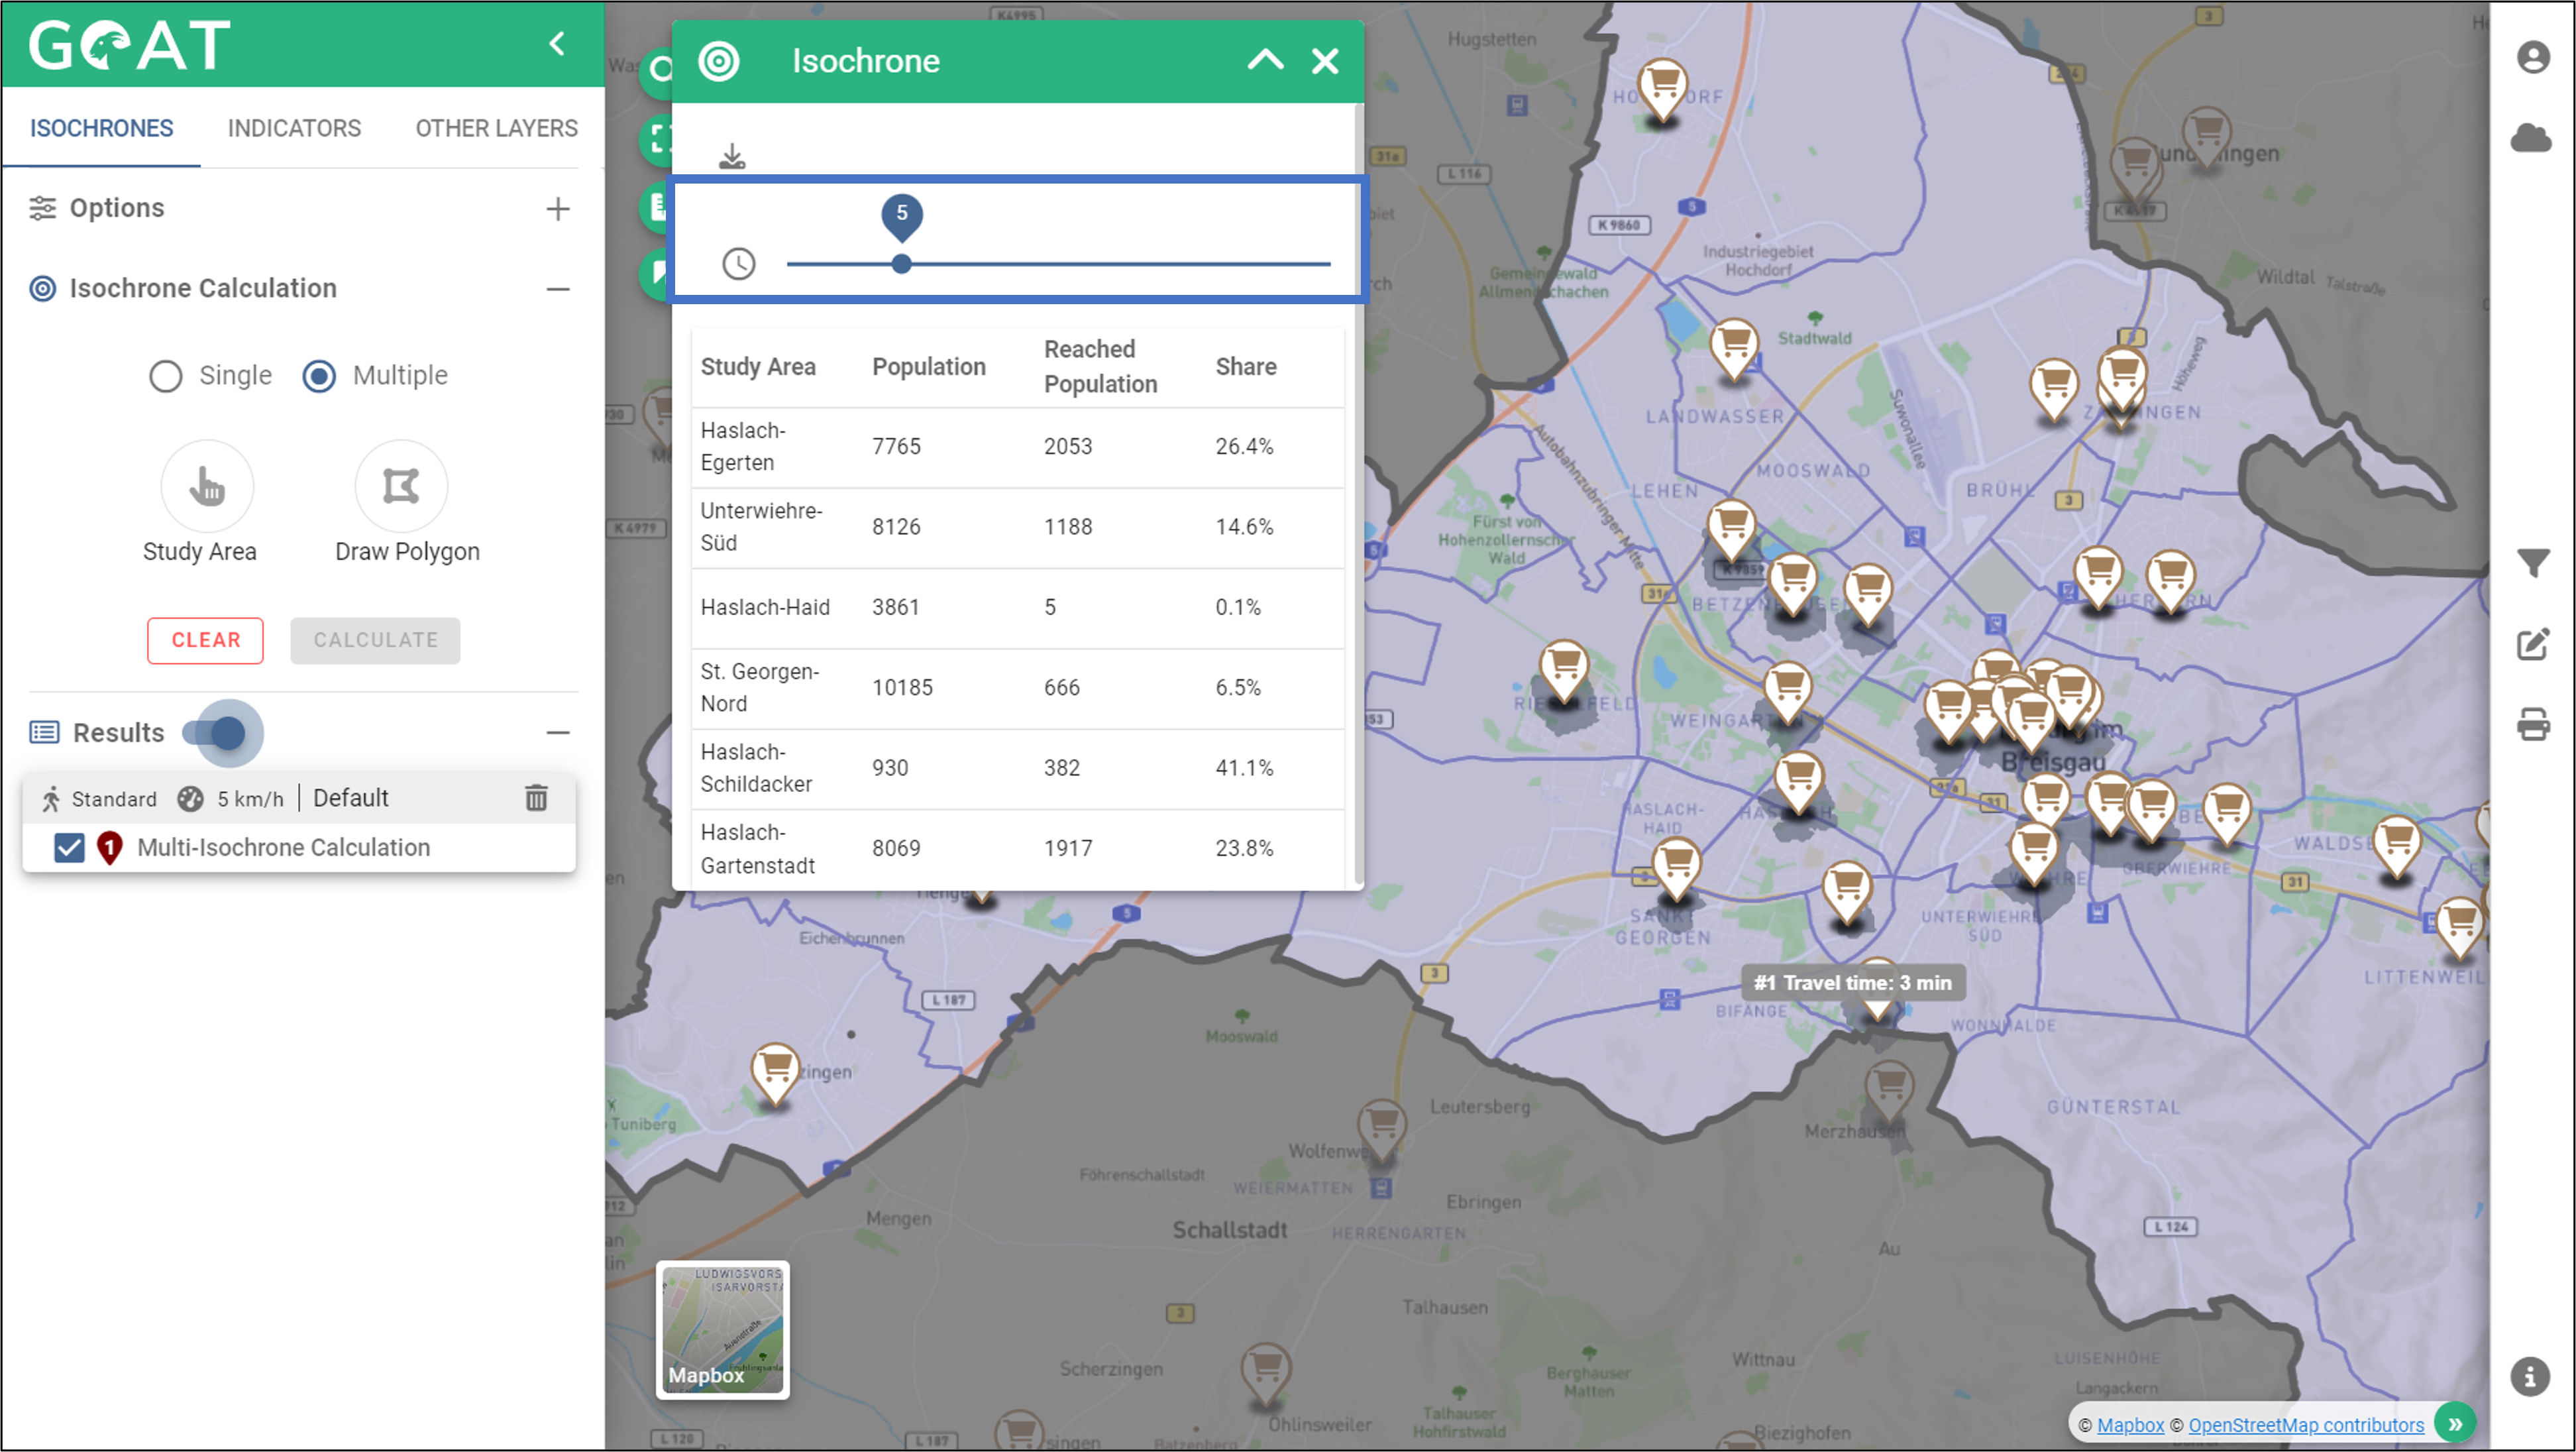
- Similar to the single isochrones, the travel times of the multi-isochrones can be adjusted dyamically via the slider.
2 Accessibility to public transport
1.1 Planning question
How many inhabitants can reach a public transport stop by bicycle in a given travel time?
1.2 Step-by-Step guide
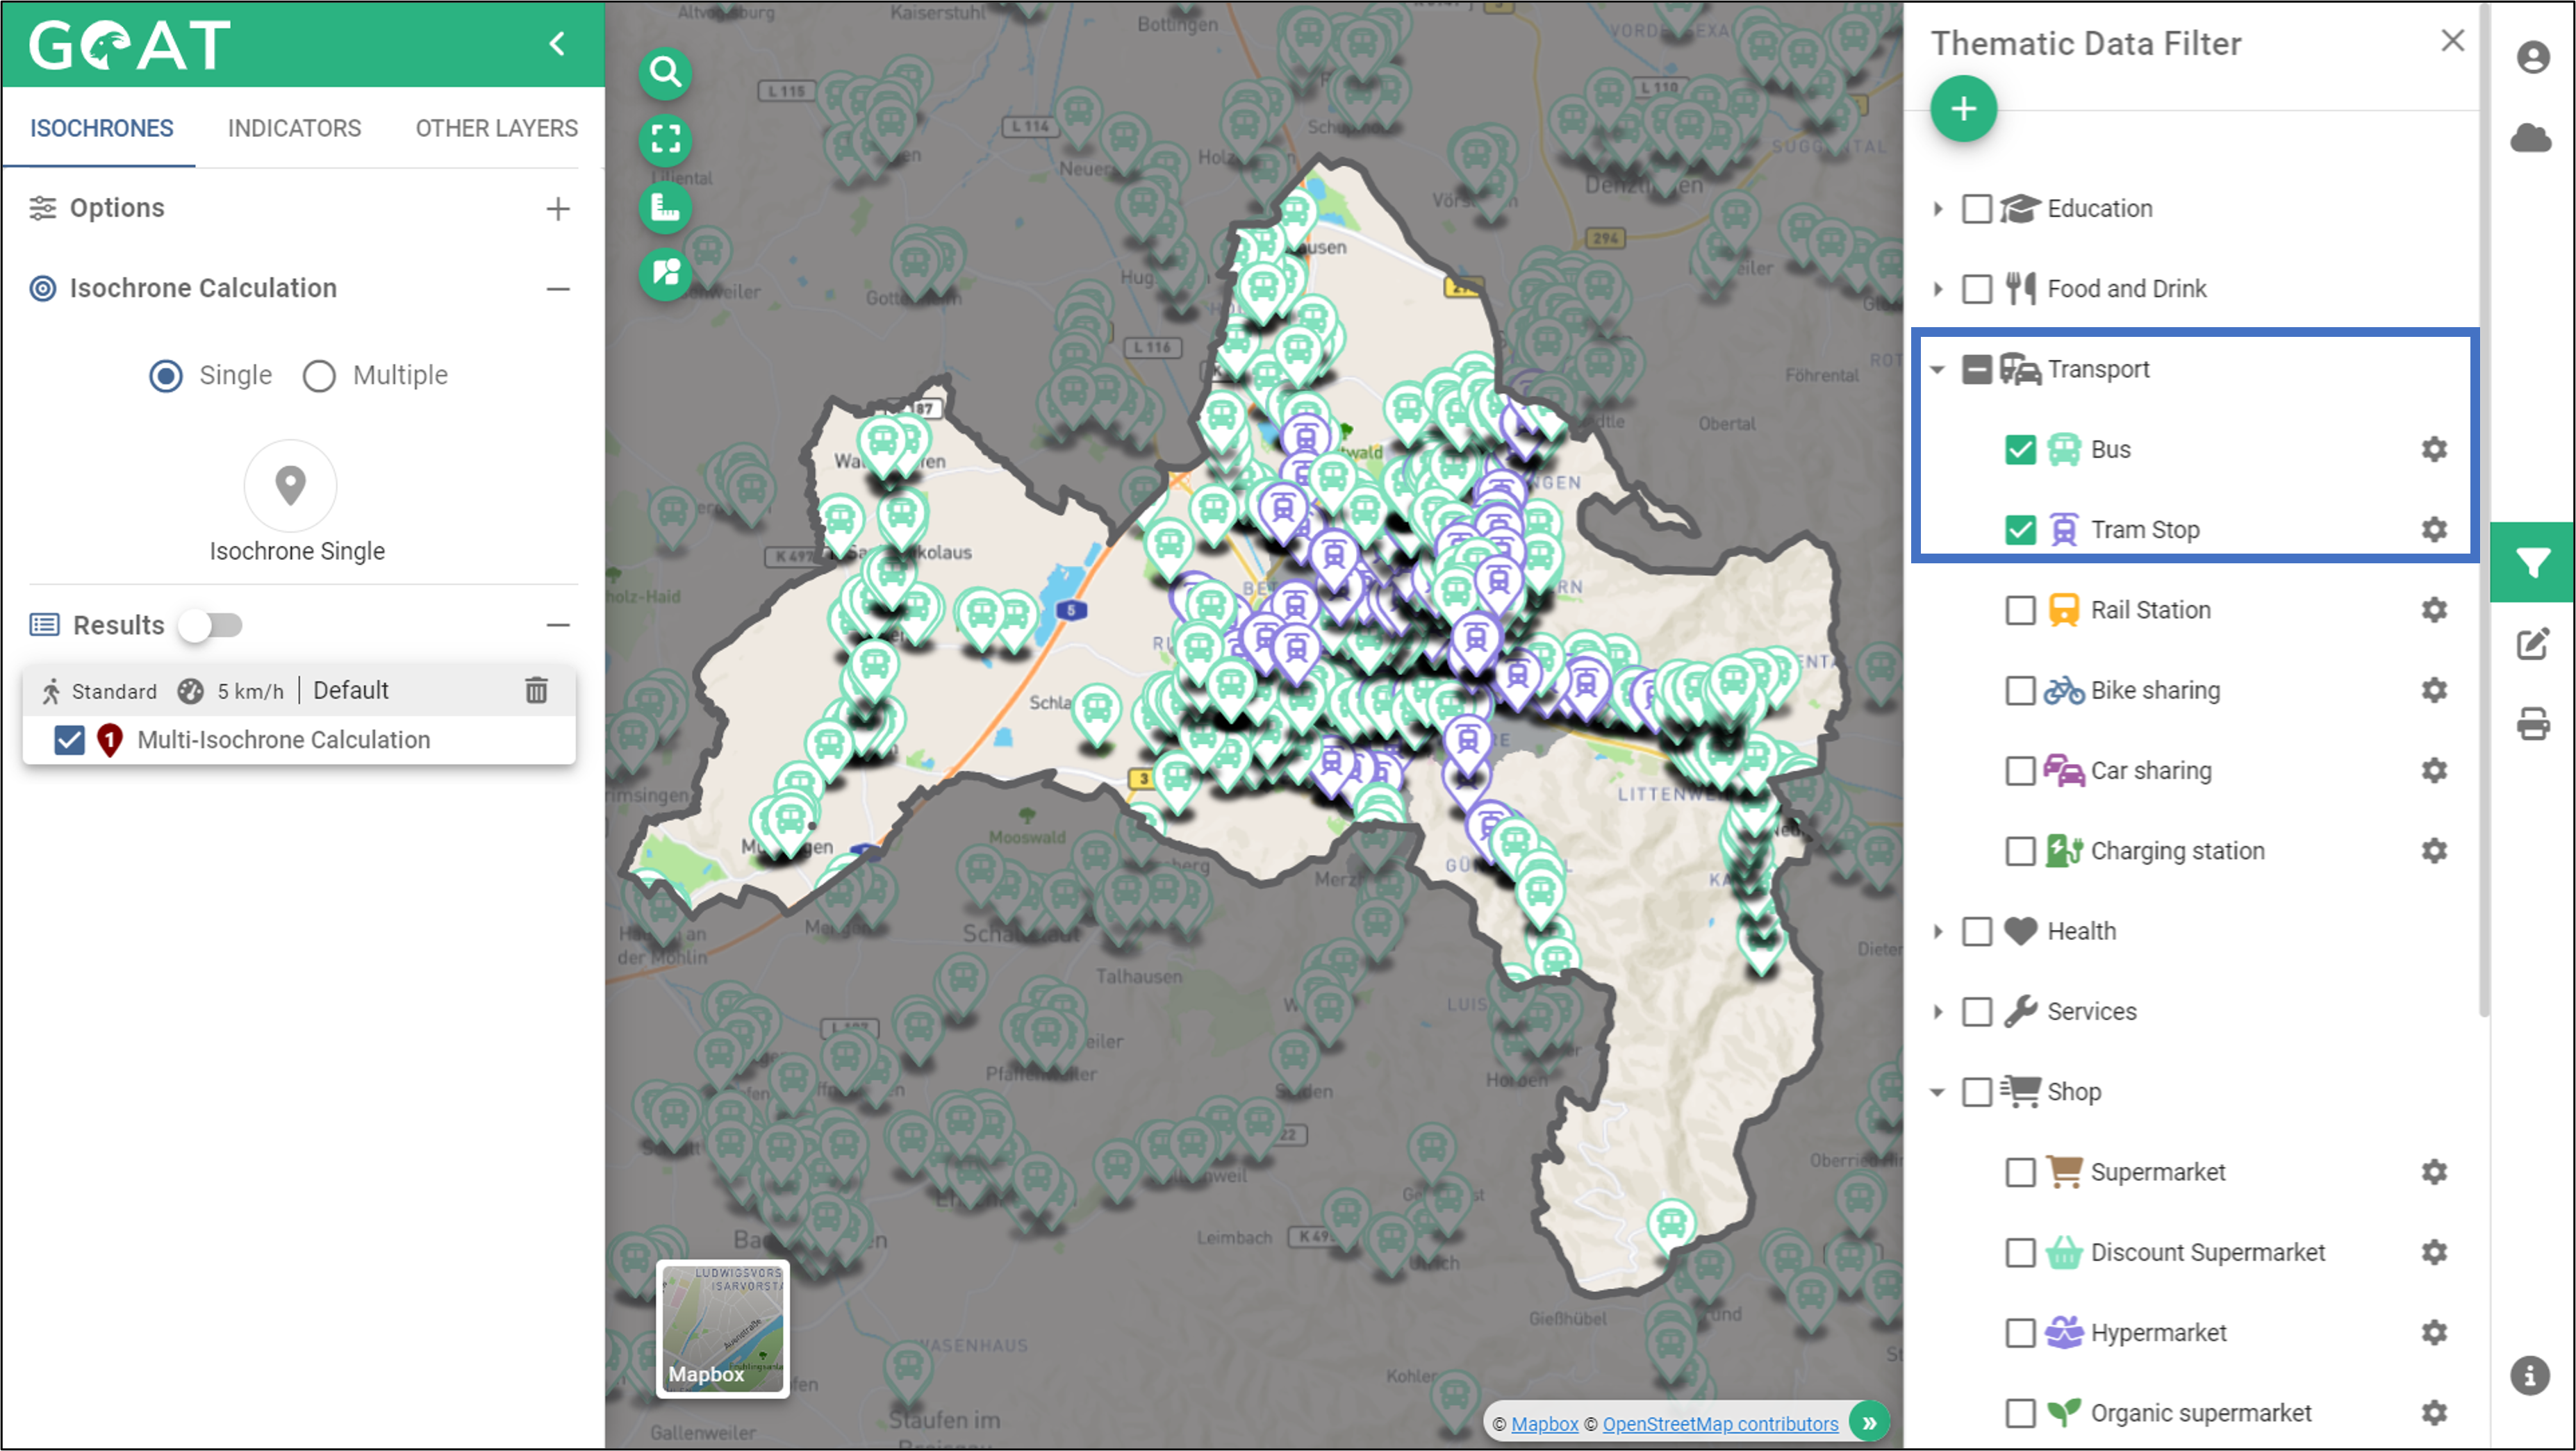
- Select the desired public transport stops (e.g. bus, tram) in the menu “Filter Thematic Data”.
Set the routing options as desired (e.g. bike, 15km/h).
Switch to the isochrone calculation mode “Multi” and select the method “District” and select the districts on the map or draw a polygon.
Click on “Calculate”.
The resulting multi-isochrones show you the catchment areas of the public transport stops (here for the mode “bicycle” with 10 minutes catchment area). The corresponding table shows, sorted by district, how many people of the total population can reach a public transport stop in 10 minutes by bike.