Description of the feature
GOAT allows the development of personalized scenarios for changes in the building structure, such as the construction of a new residential area or the demolition of an old building. The developed scenario can be added to the existing urban structure and the changes in accessibility can be evaluated.
Possible use cases (planning questions)
- How does a new residential area effect the accessibility to kindergartens in a certain neighbourhood?
- Is the population in a new residential area served with the everyday necessities?
- Where is the potential for further settlement development?
Video Tutorial
Step-by-step tutorial for the exemplary planning task
1 Scenario on new residential development
1.1 Planning question
- How many additional residents have access to a primary school within a 10-minute walk if an existing residential area will be redensified?
1.2 Step-by-Step guide
- Display the layer “Buildings” from the category “Buildings and landuse”.
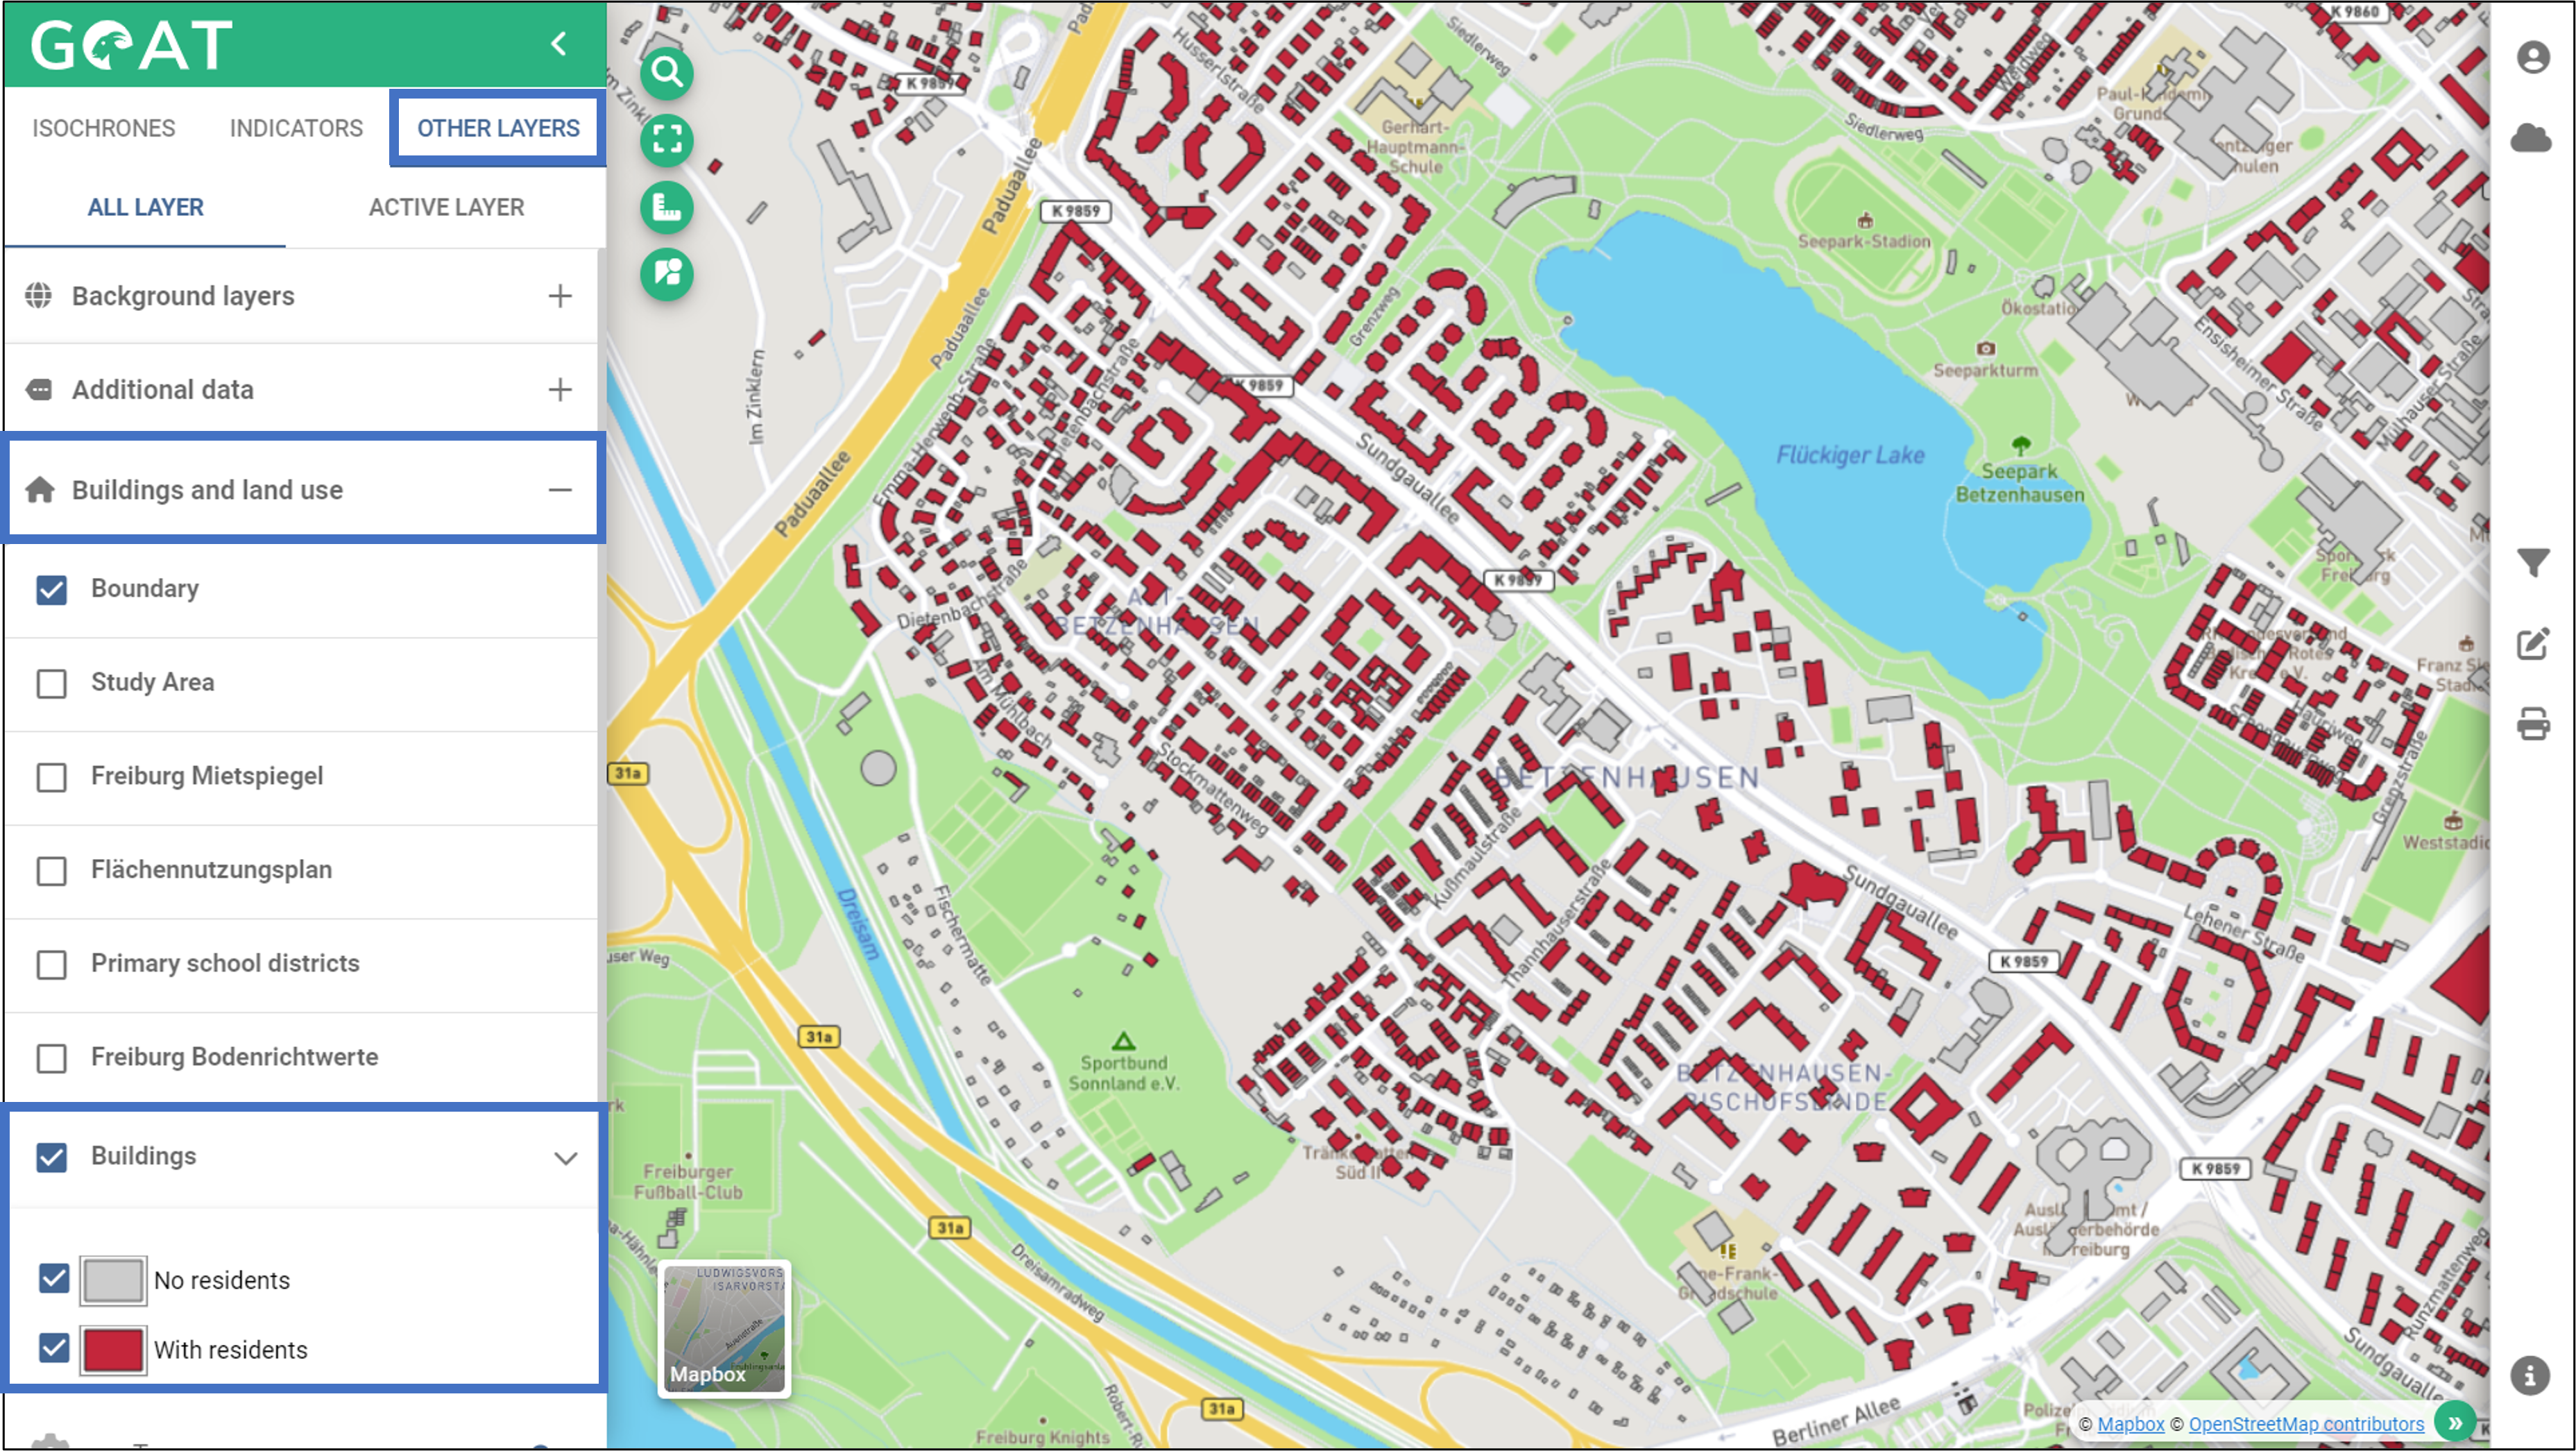
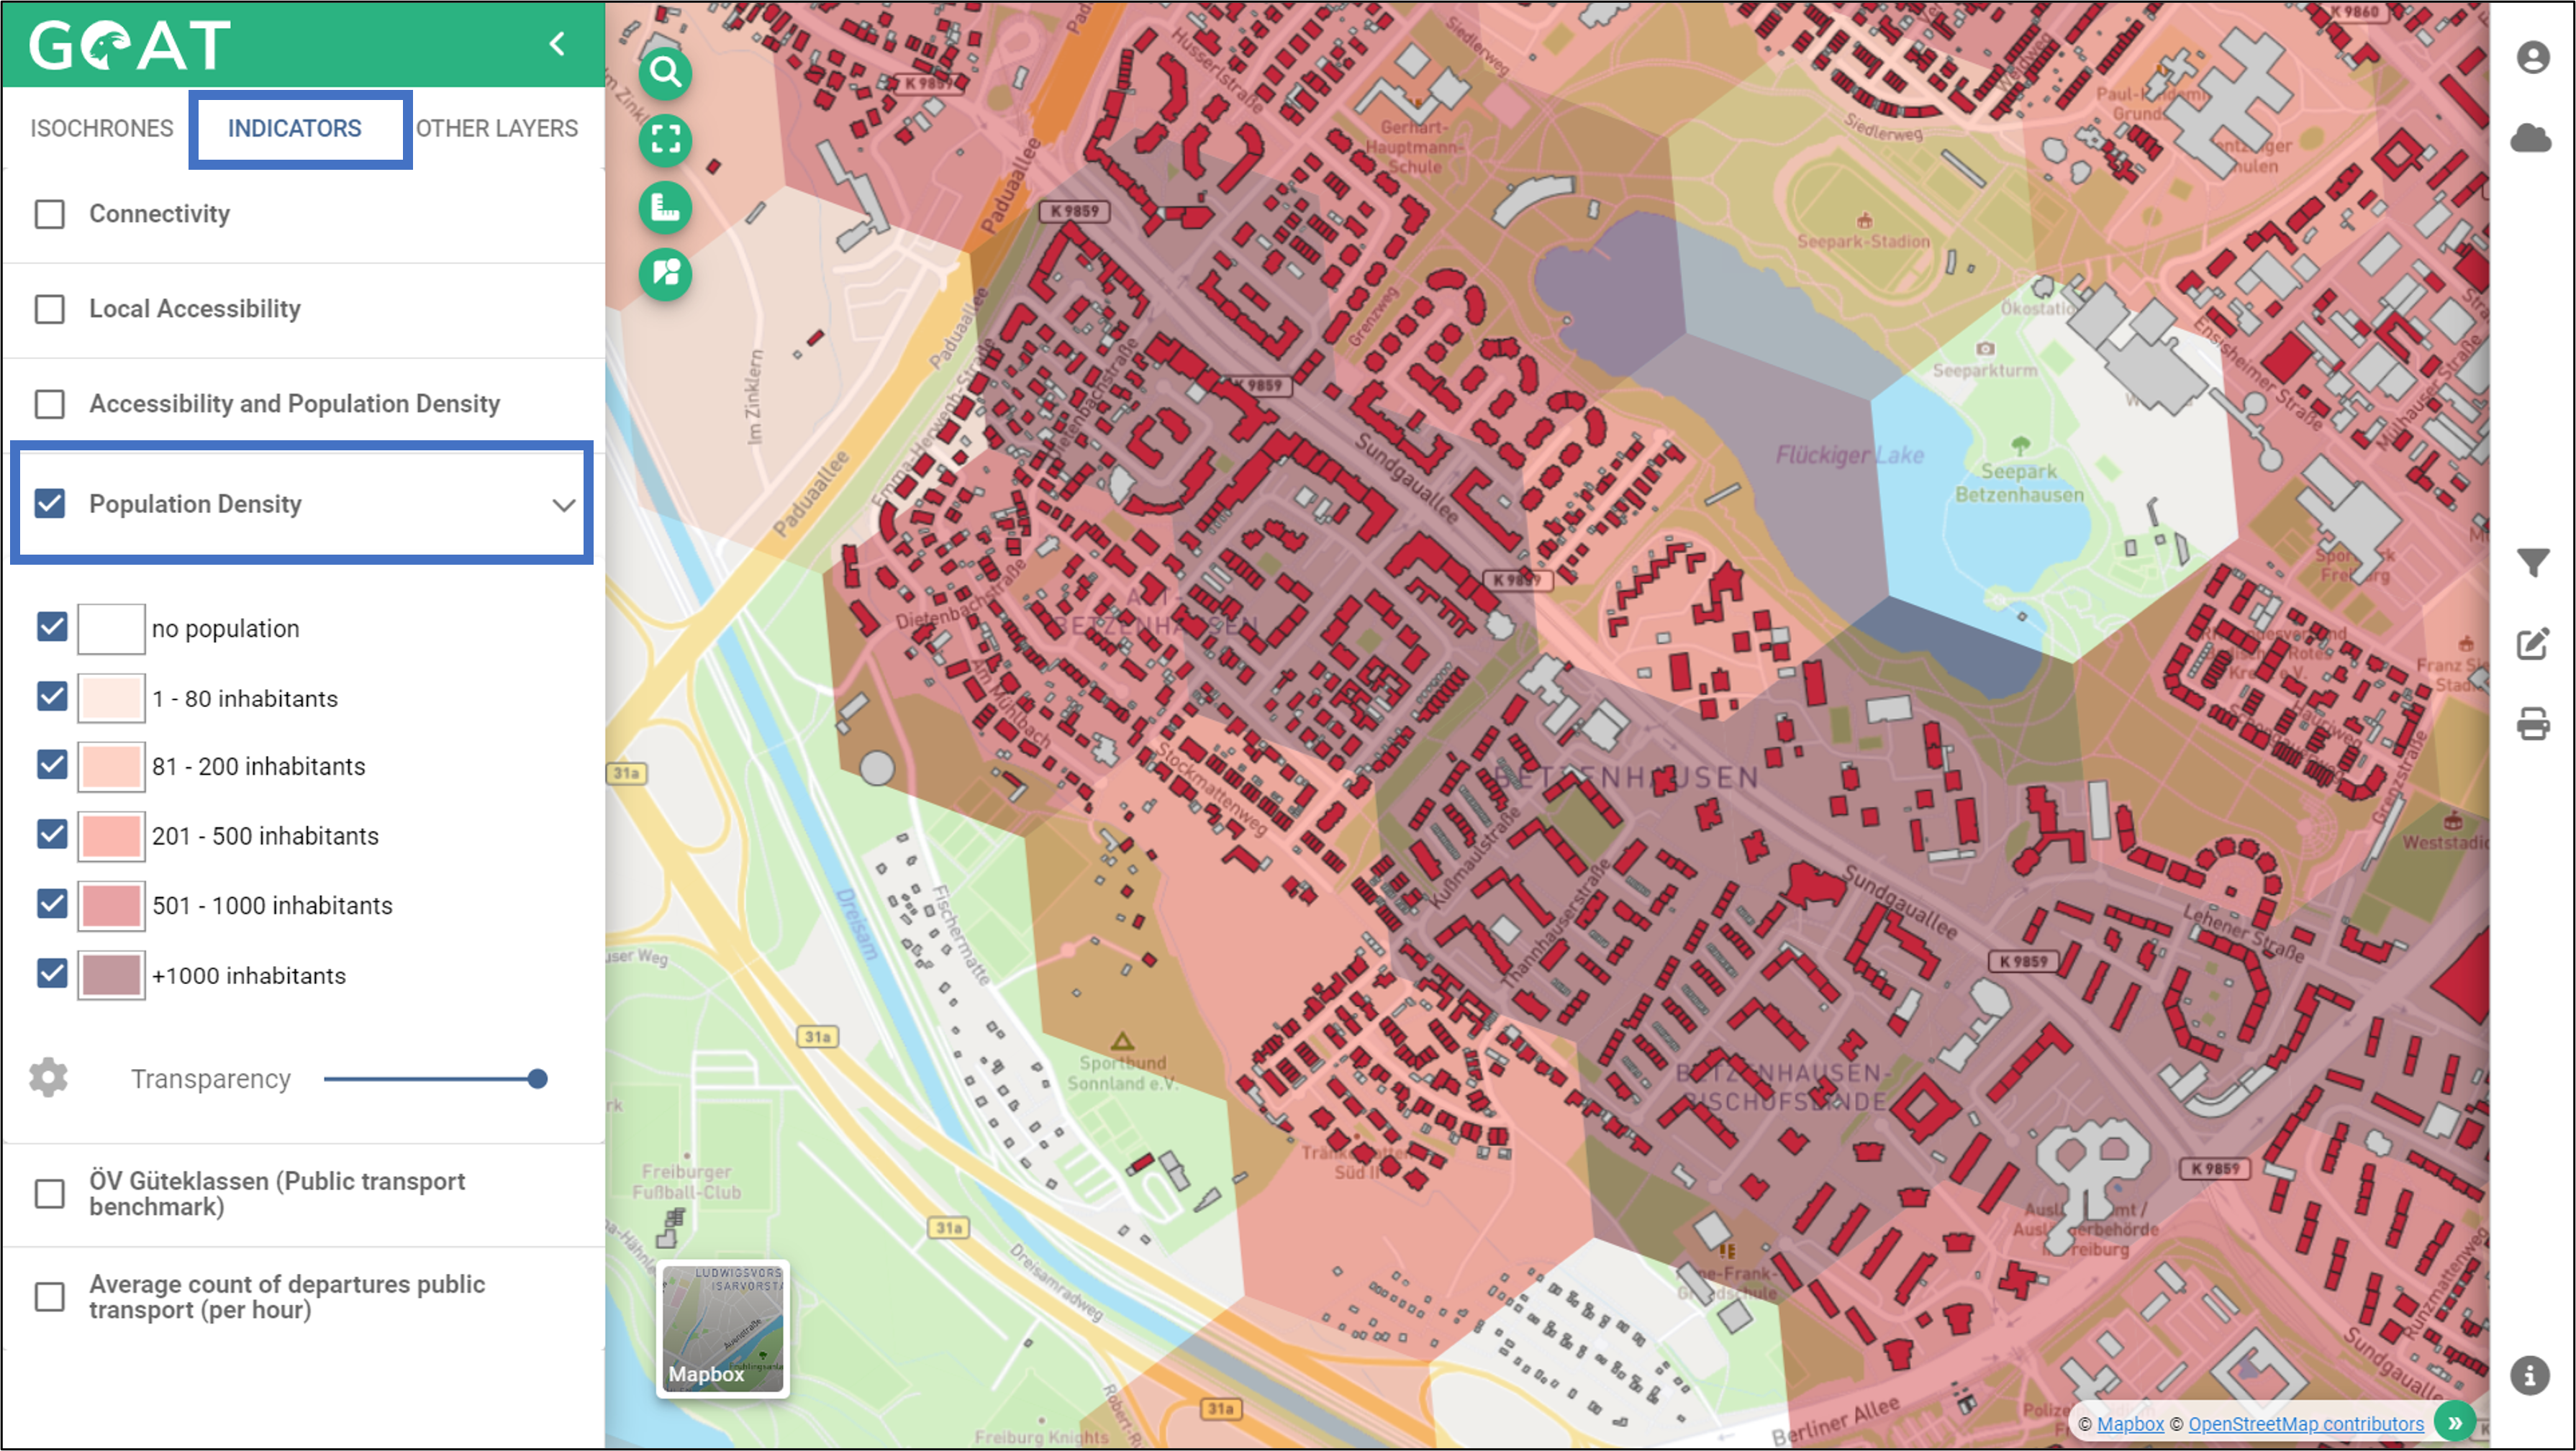
- In addition, enable the heatmap “Population Density”. These show all existing buildings (in red: buildings with residential use, in white: buildings without residential use) and the population density (the darker the background, the higher the population density).
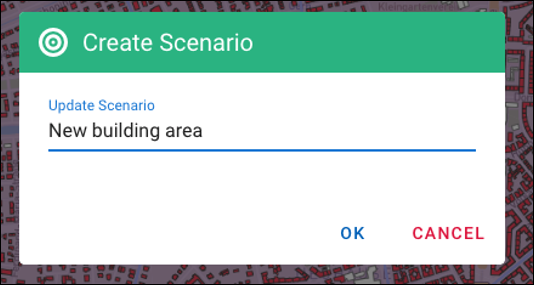
- Navigate to the scenario development menu and create a new scenario.
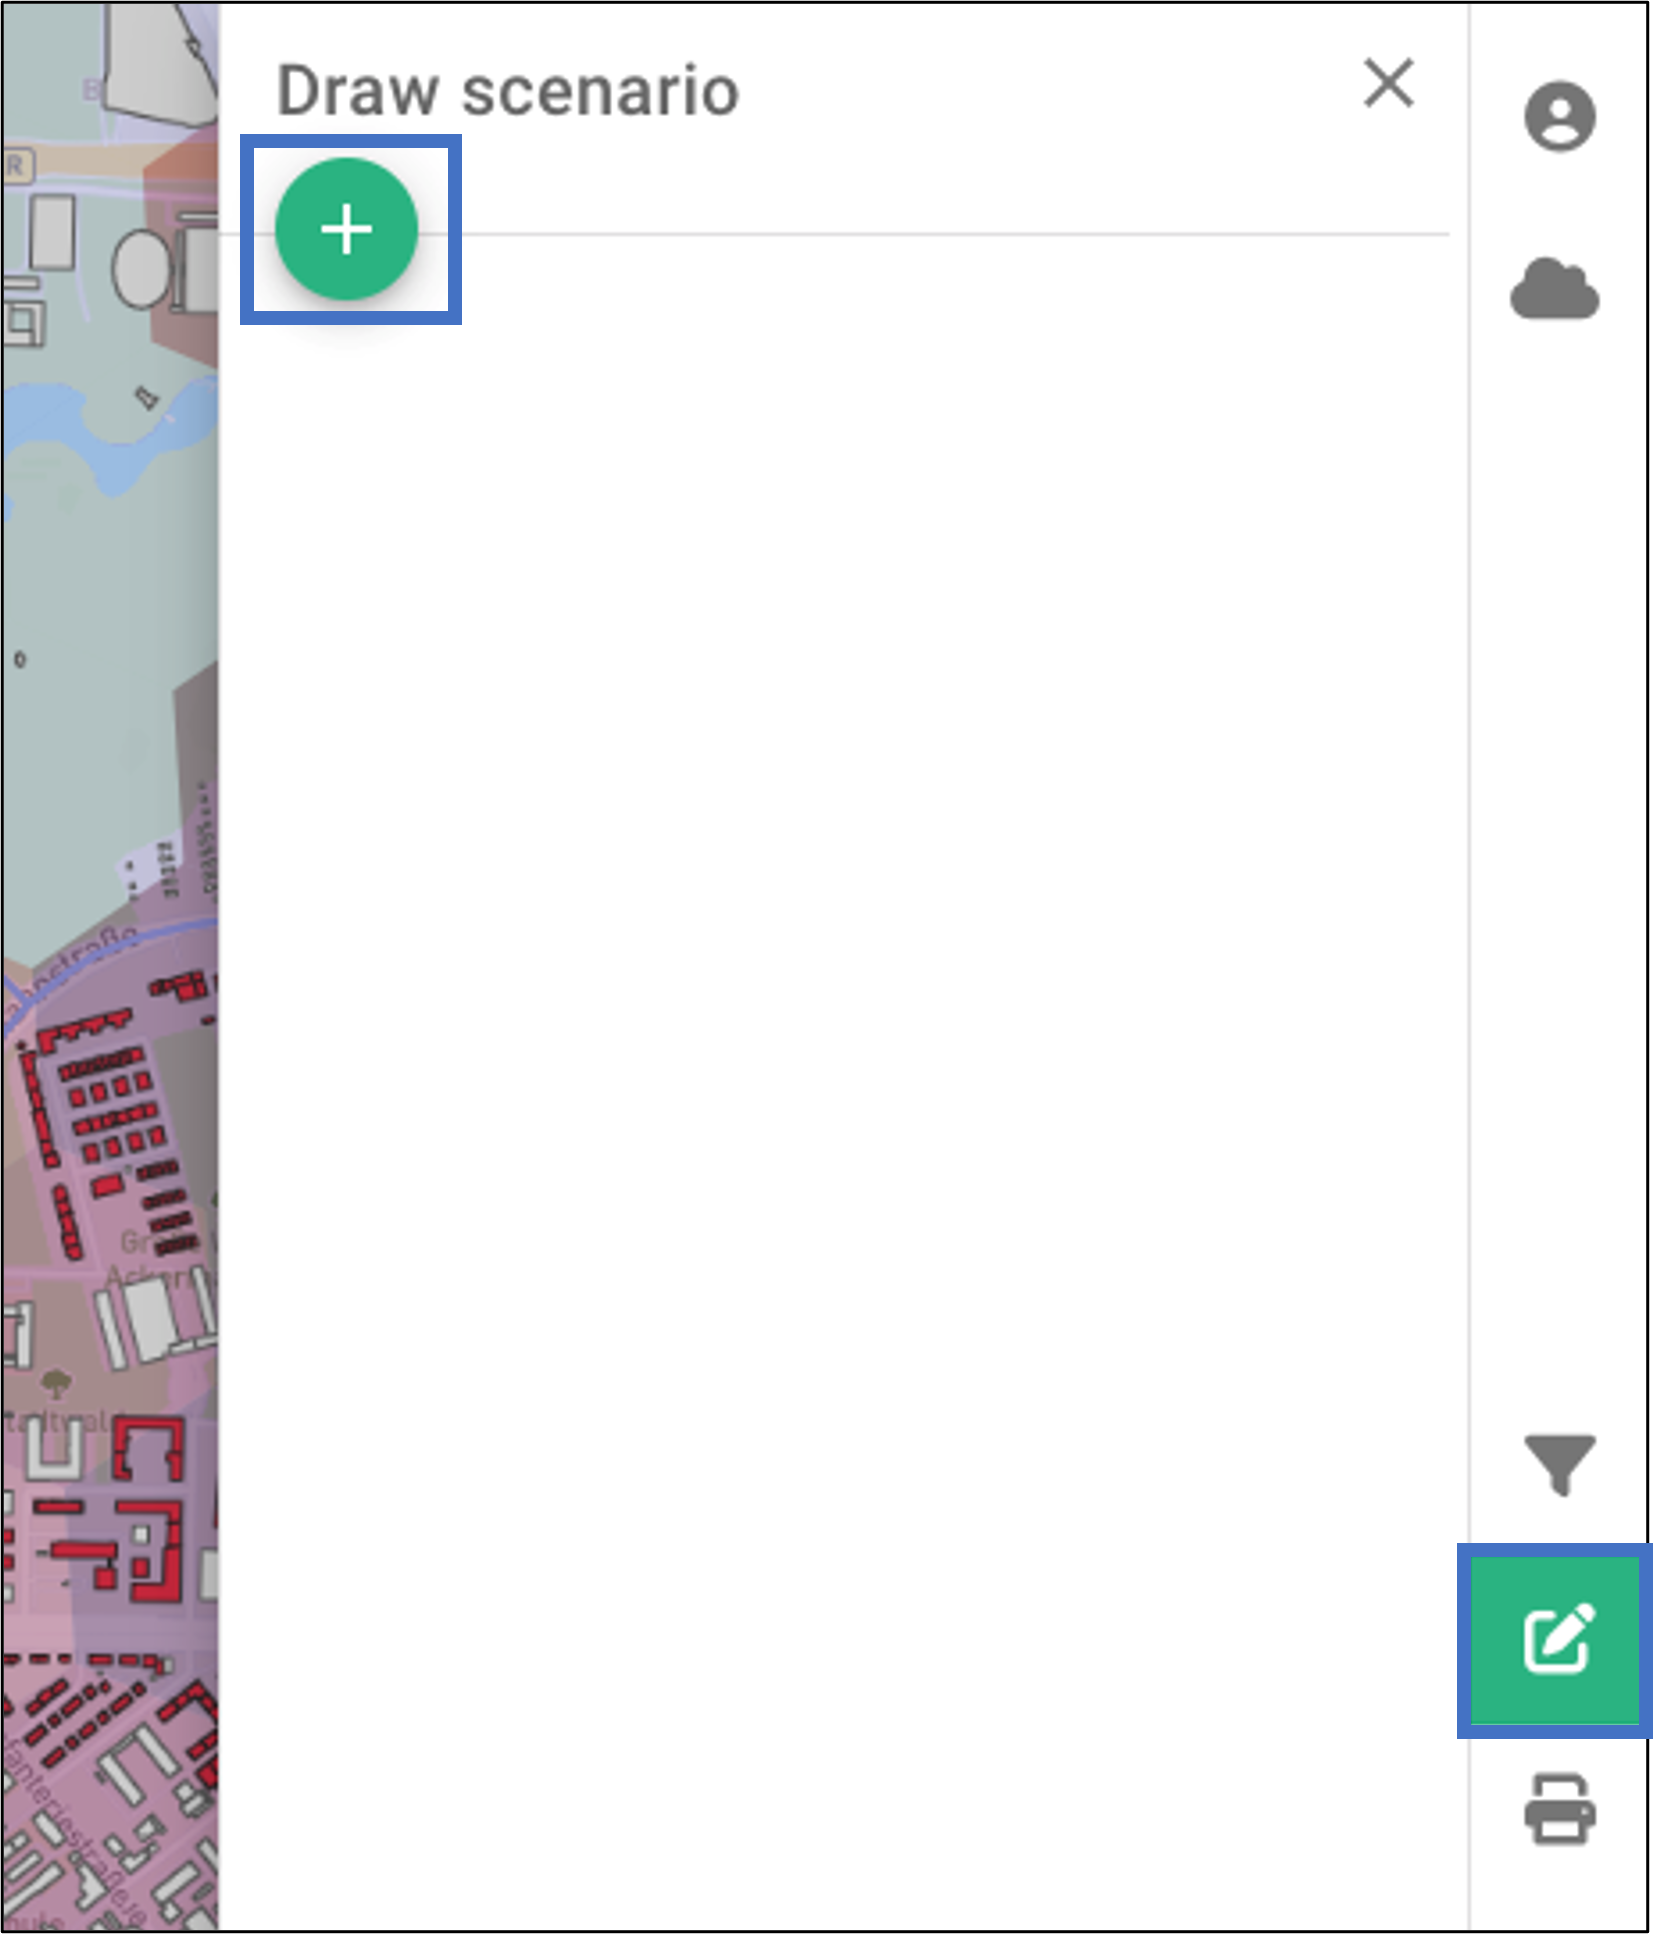
- Give the scenario a name and click on “OK.”
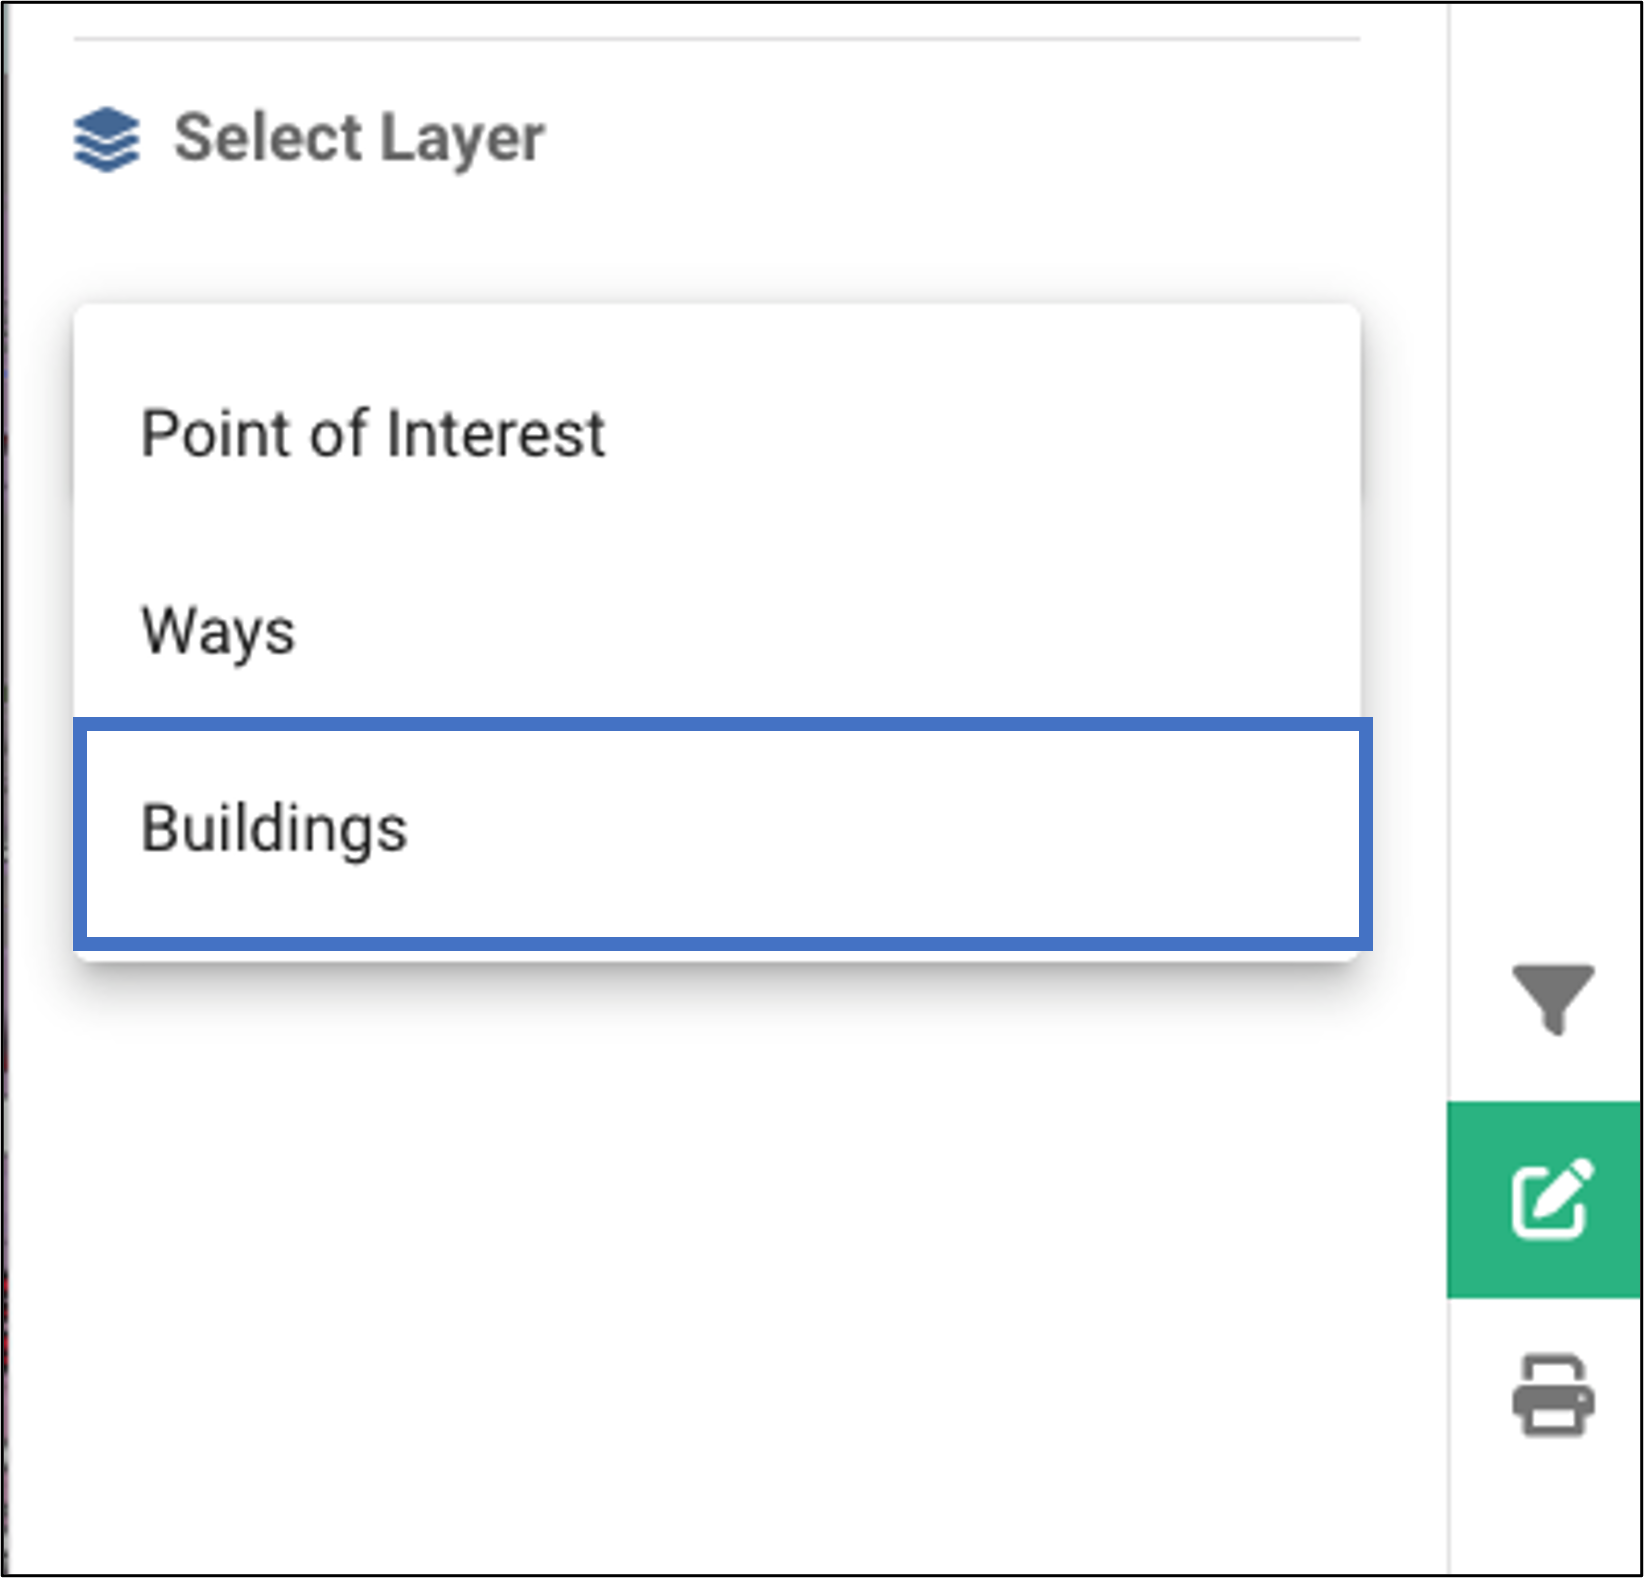
- Select which layer you want to edit, in this case the “Buildings” Layer.
- Using the editing tools, you can draw and edit new buildings. Specify the type of use and the number of floors for each new building.
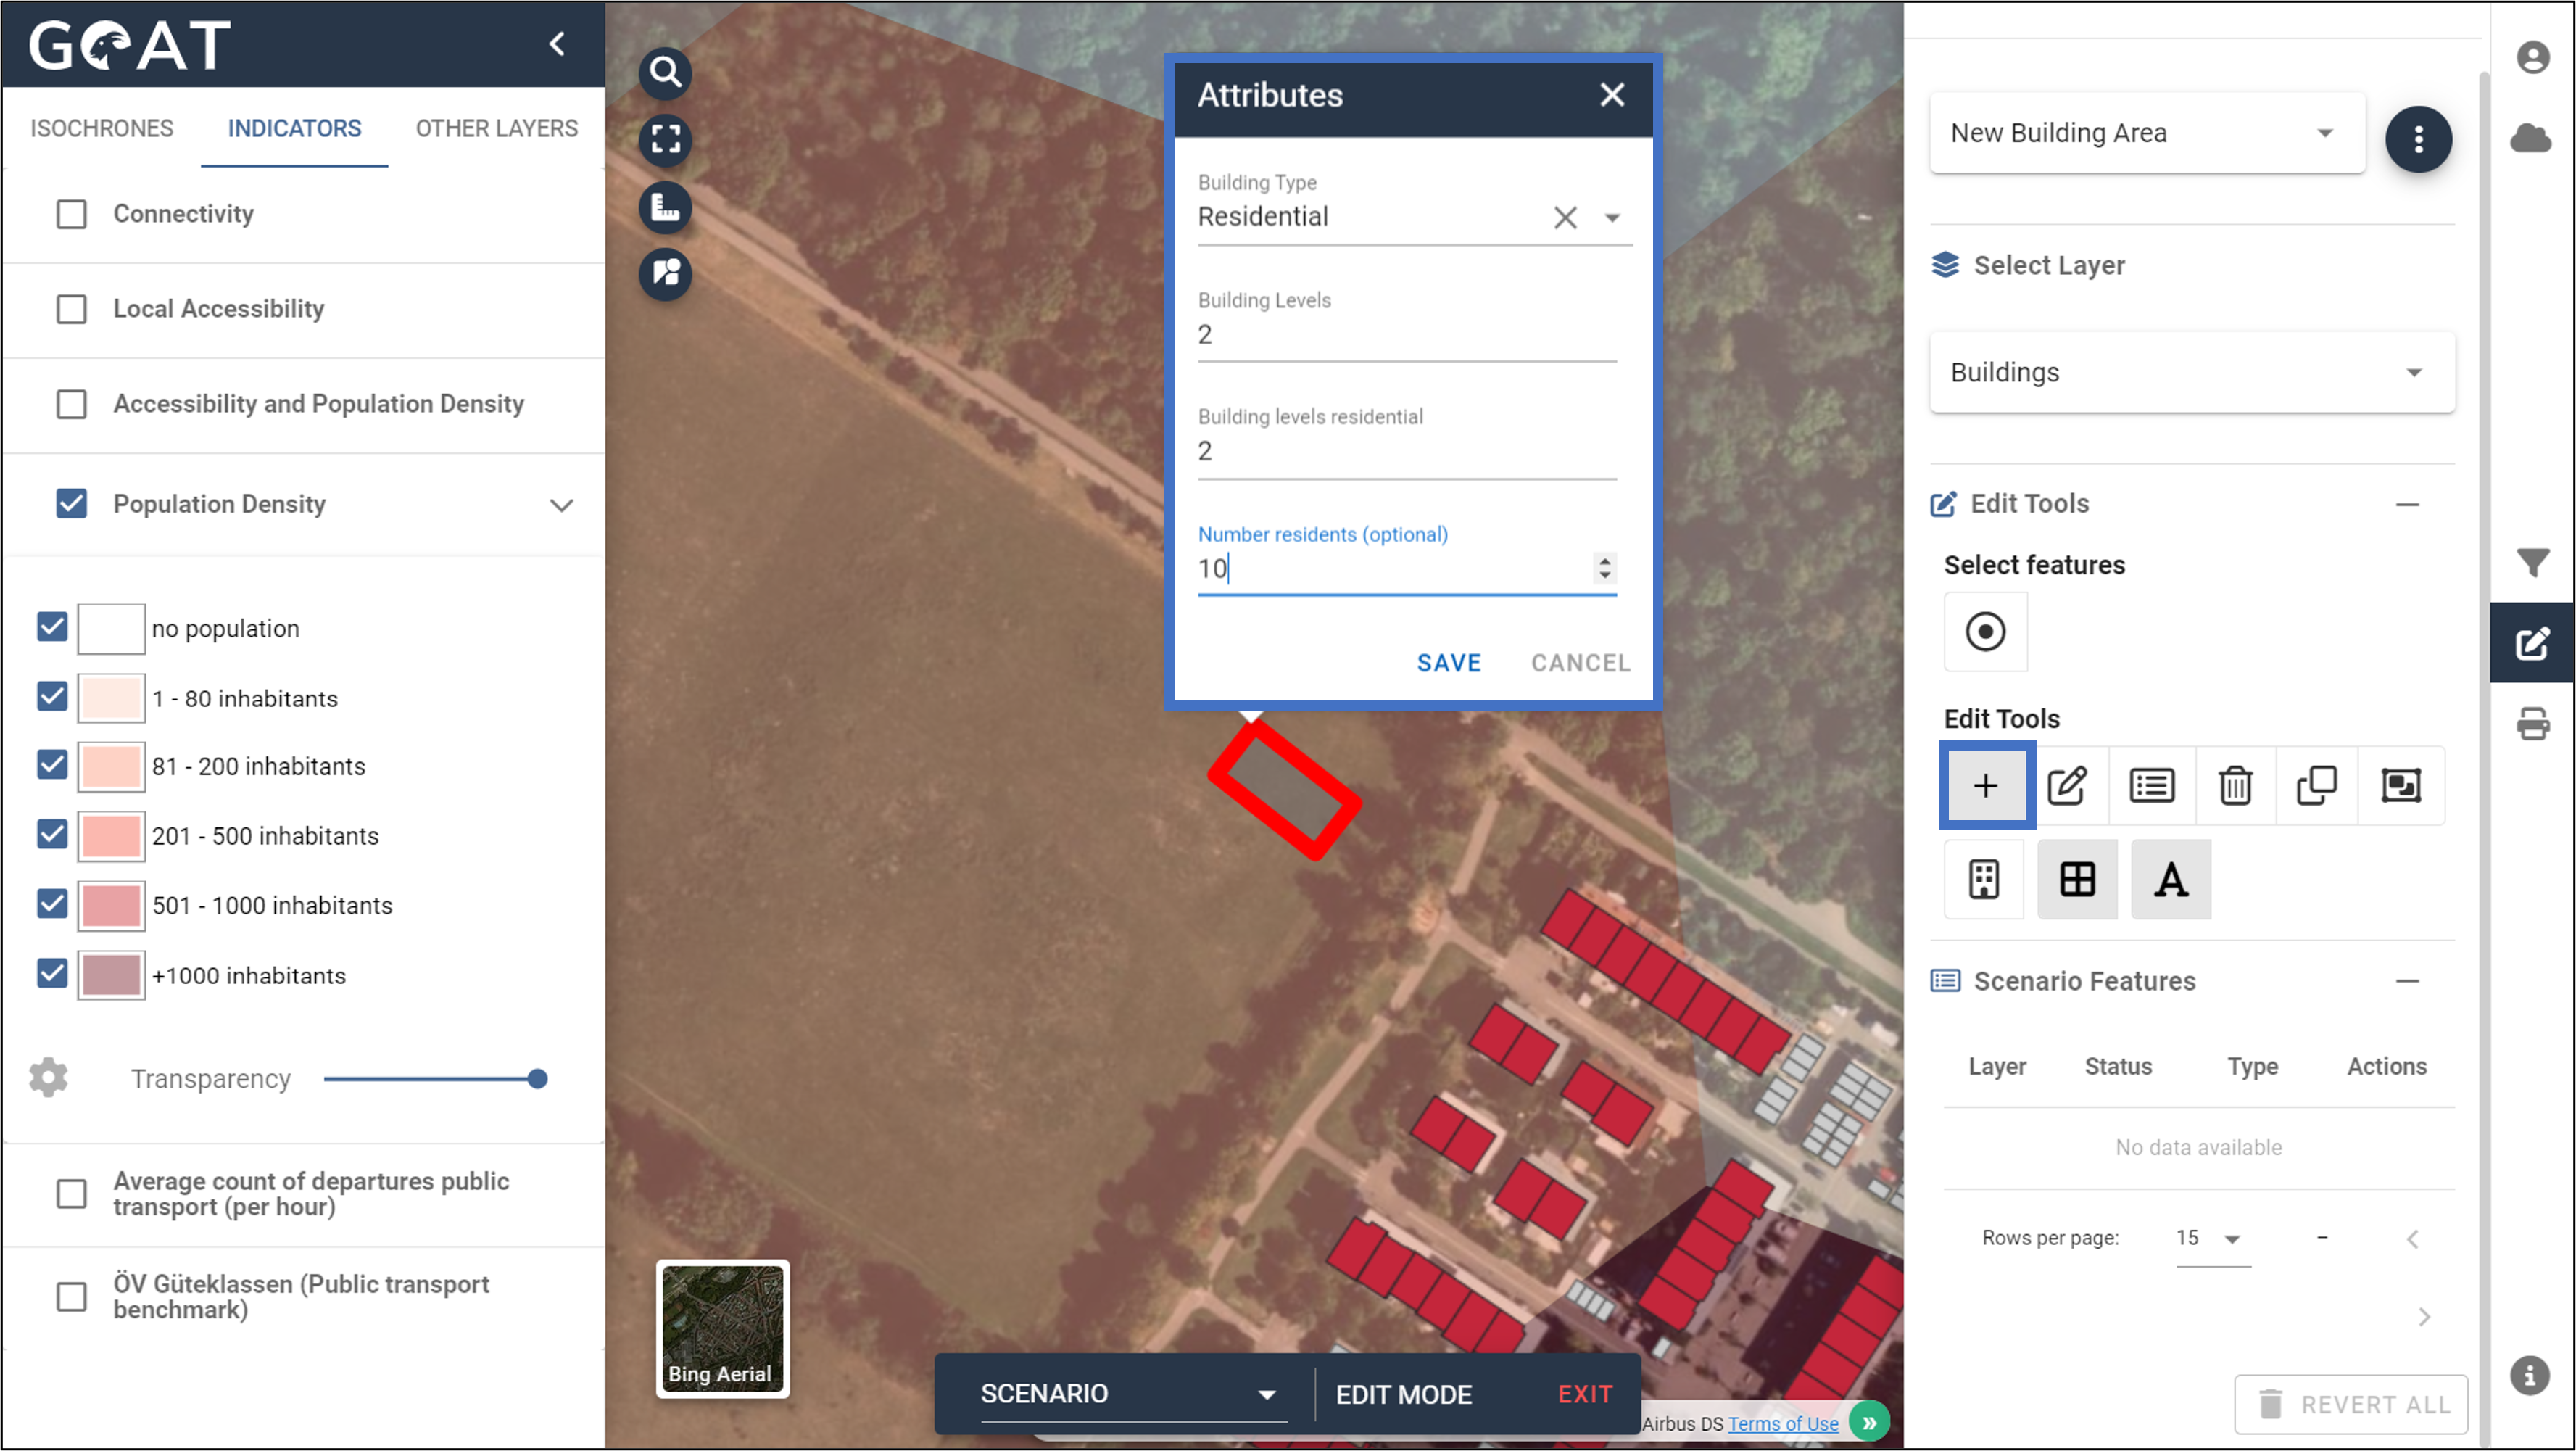
- In addition, you must set at least one entrance for each building (represented by purple dots). Once you have done this, the building will appear in green.

Display the kindergartens as Thematic Data.
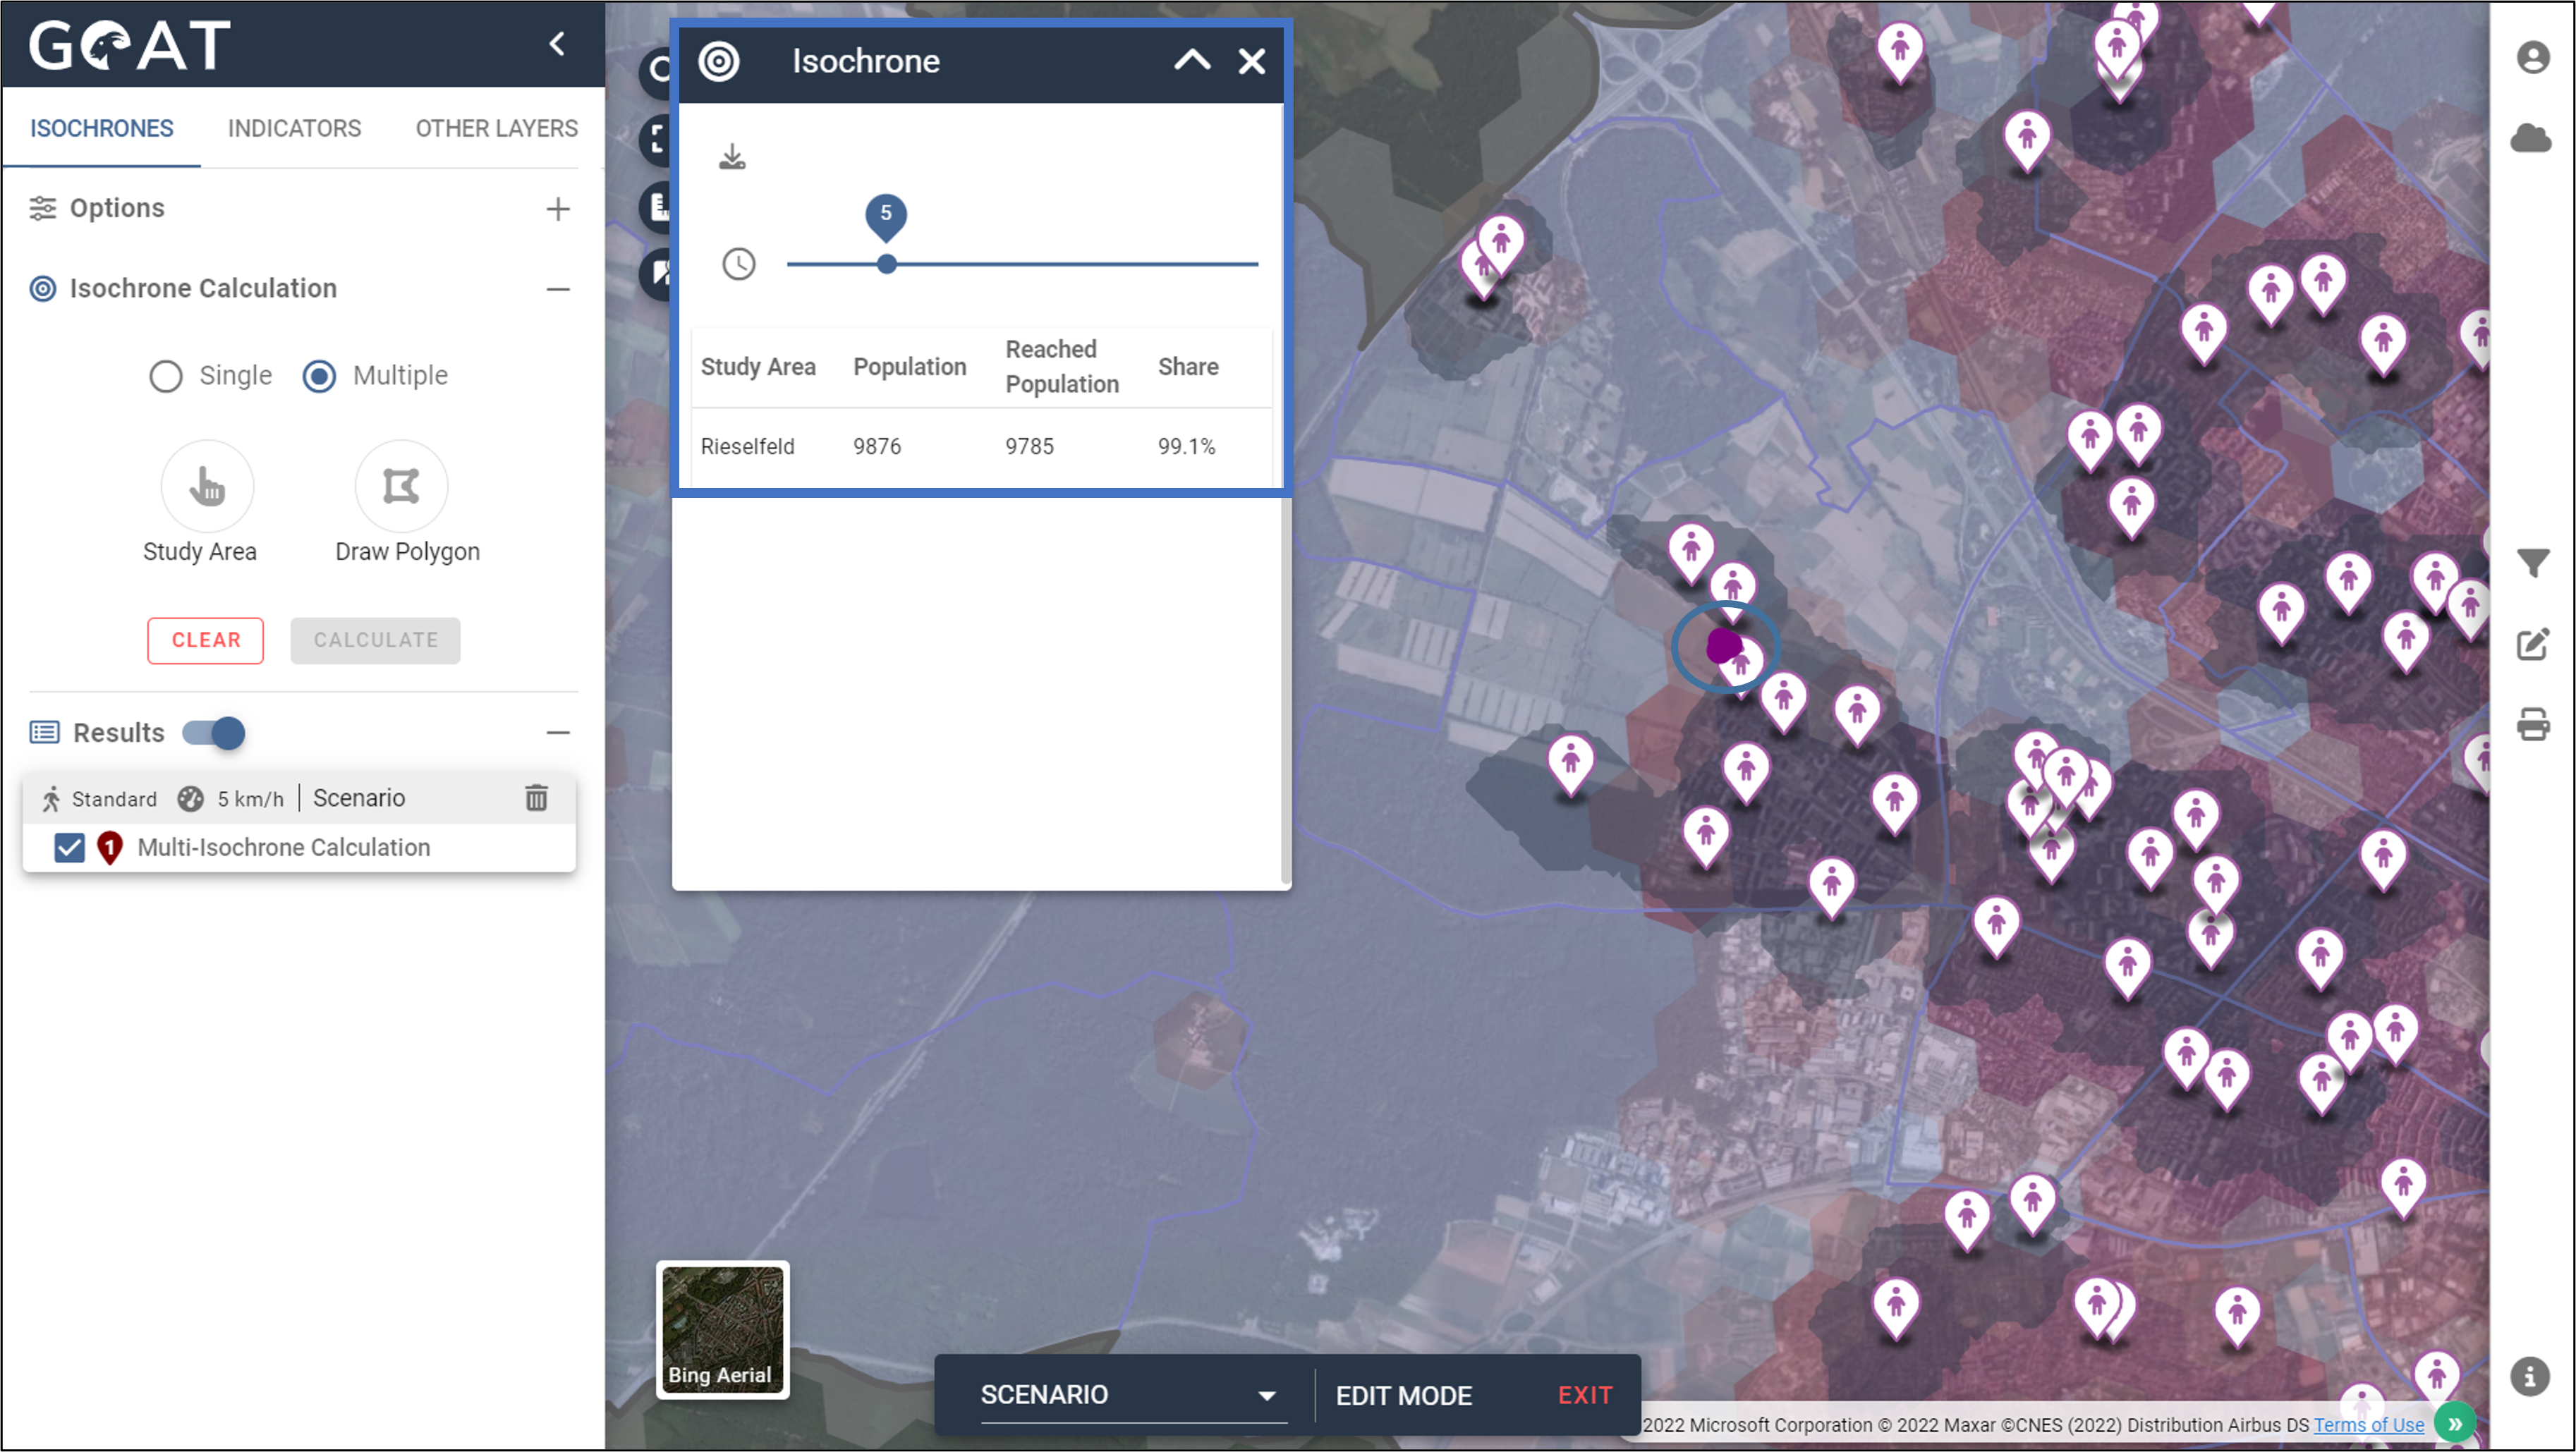
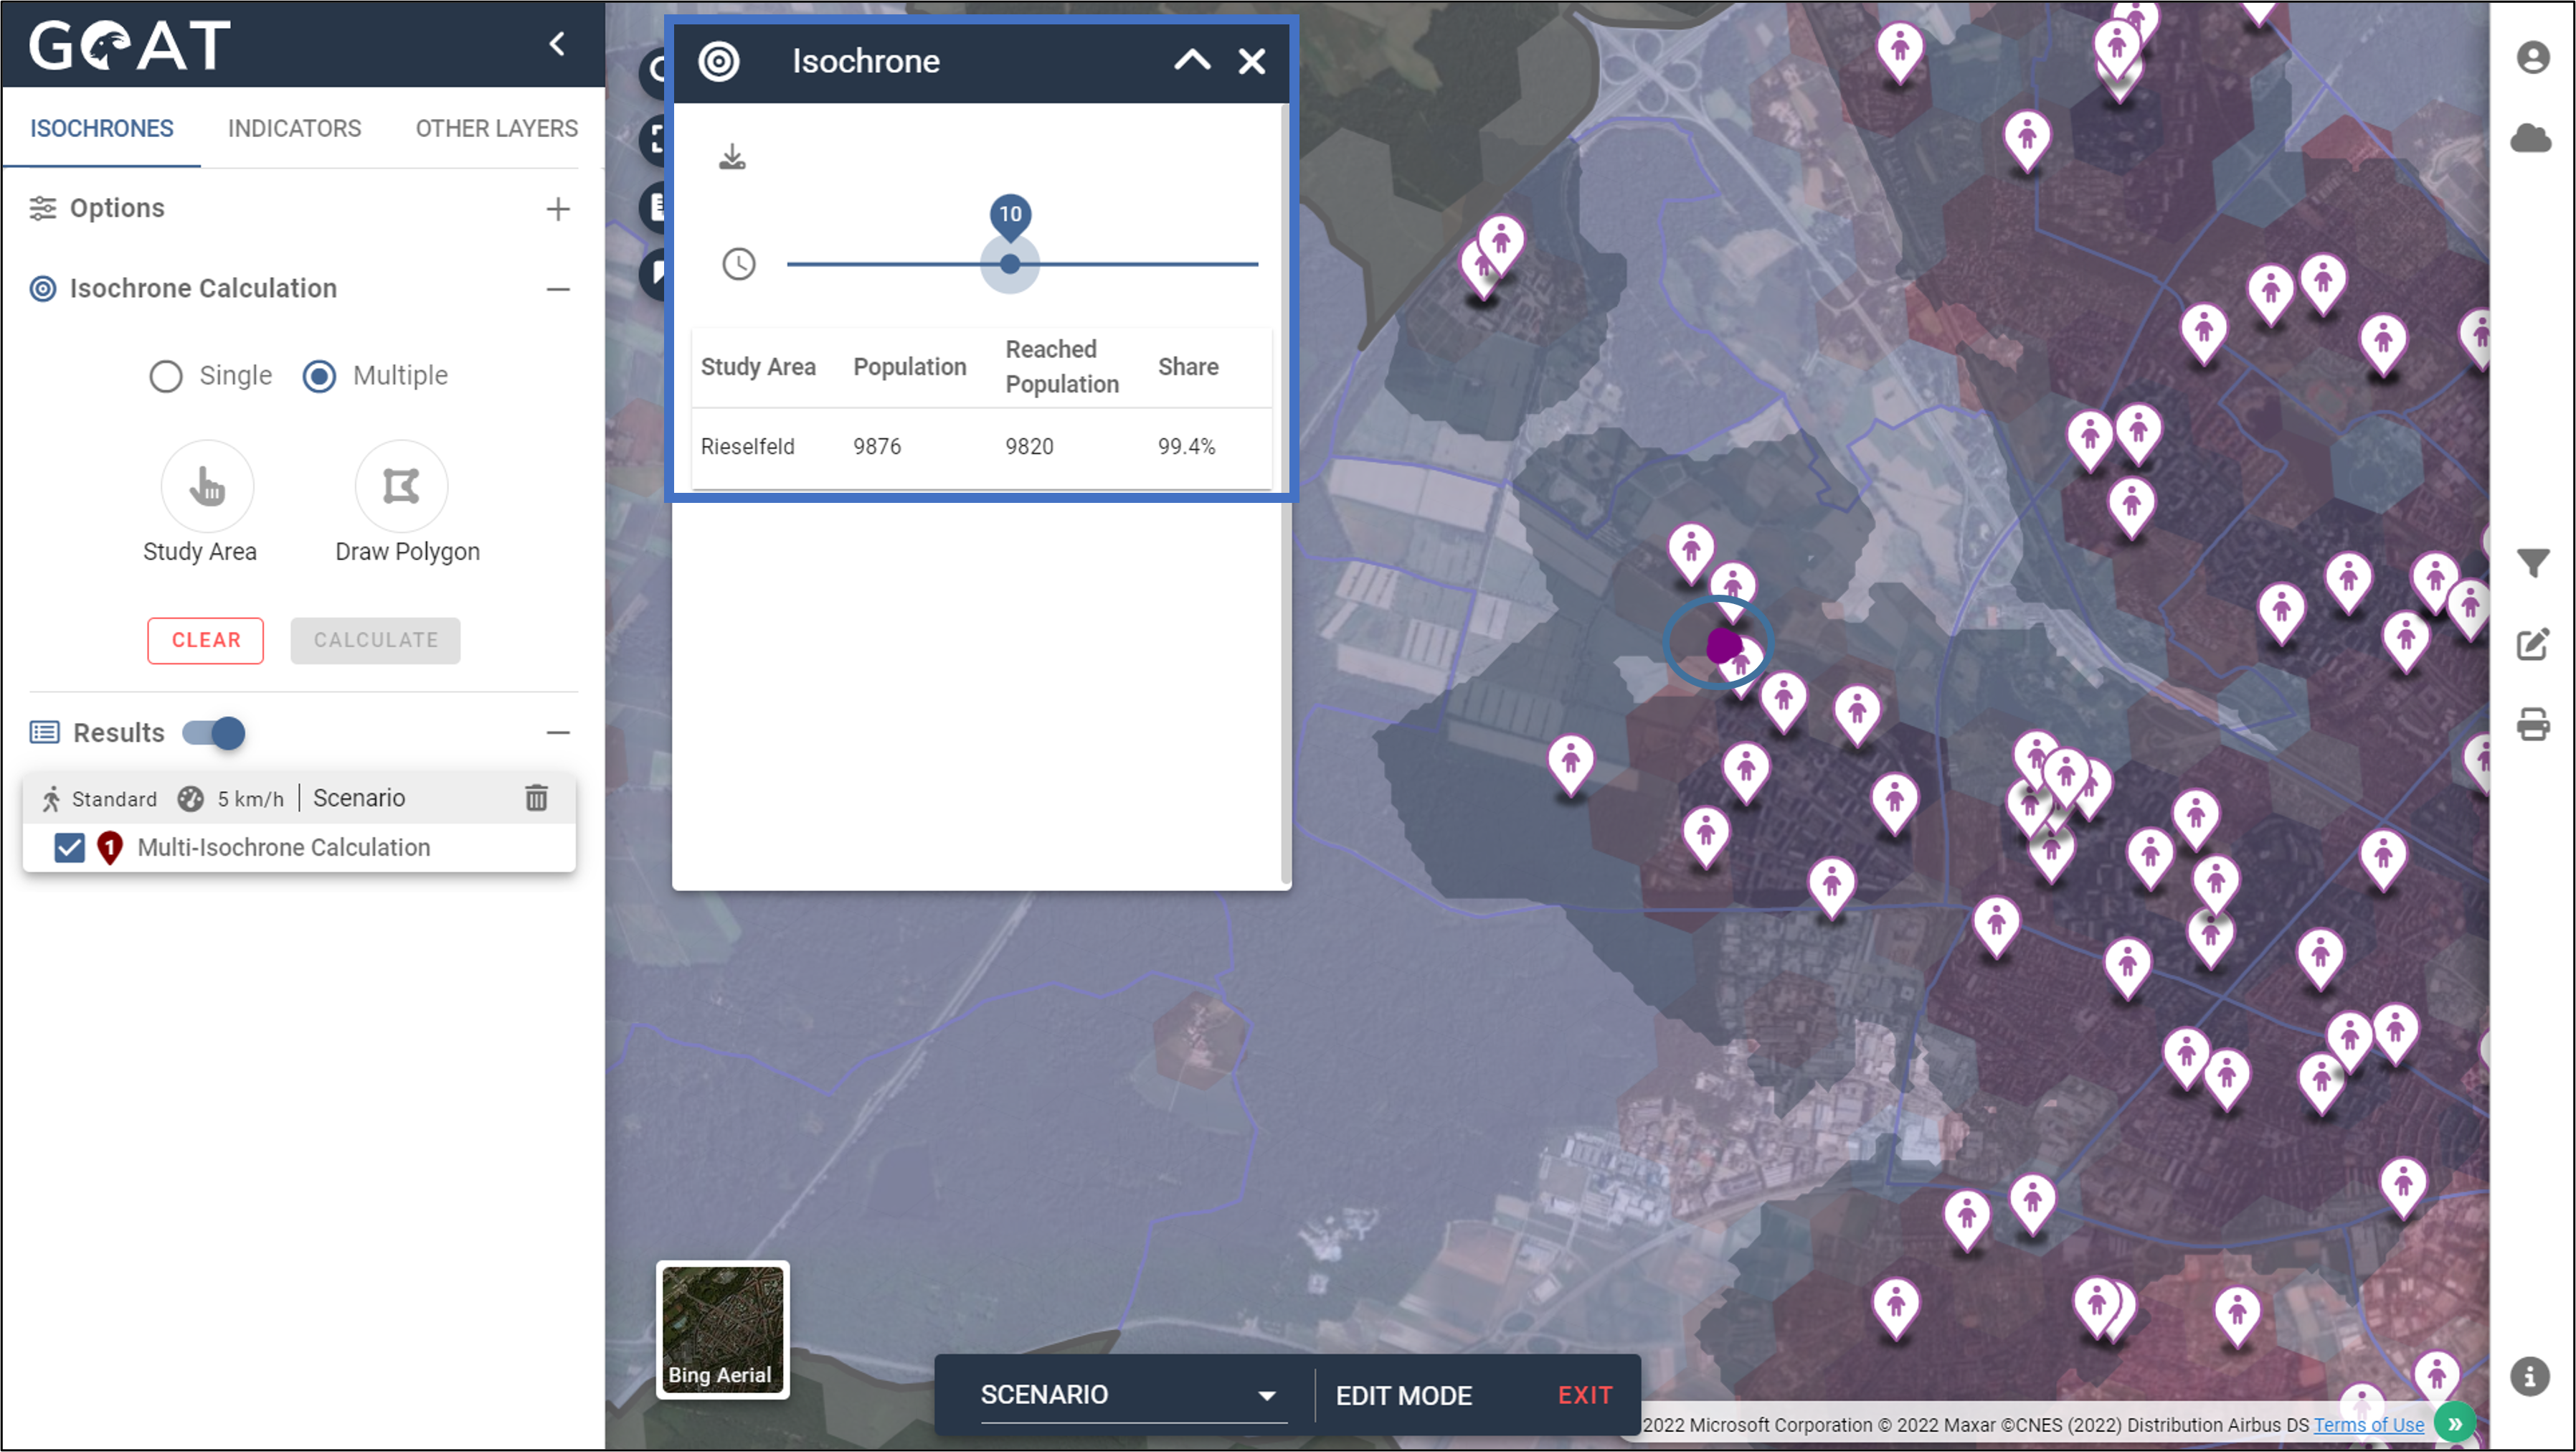
Switch to the Isochrone Menu, change to the comparison mode, select the “Multiple” isochrone calculation mode and the “Study Area” method.
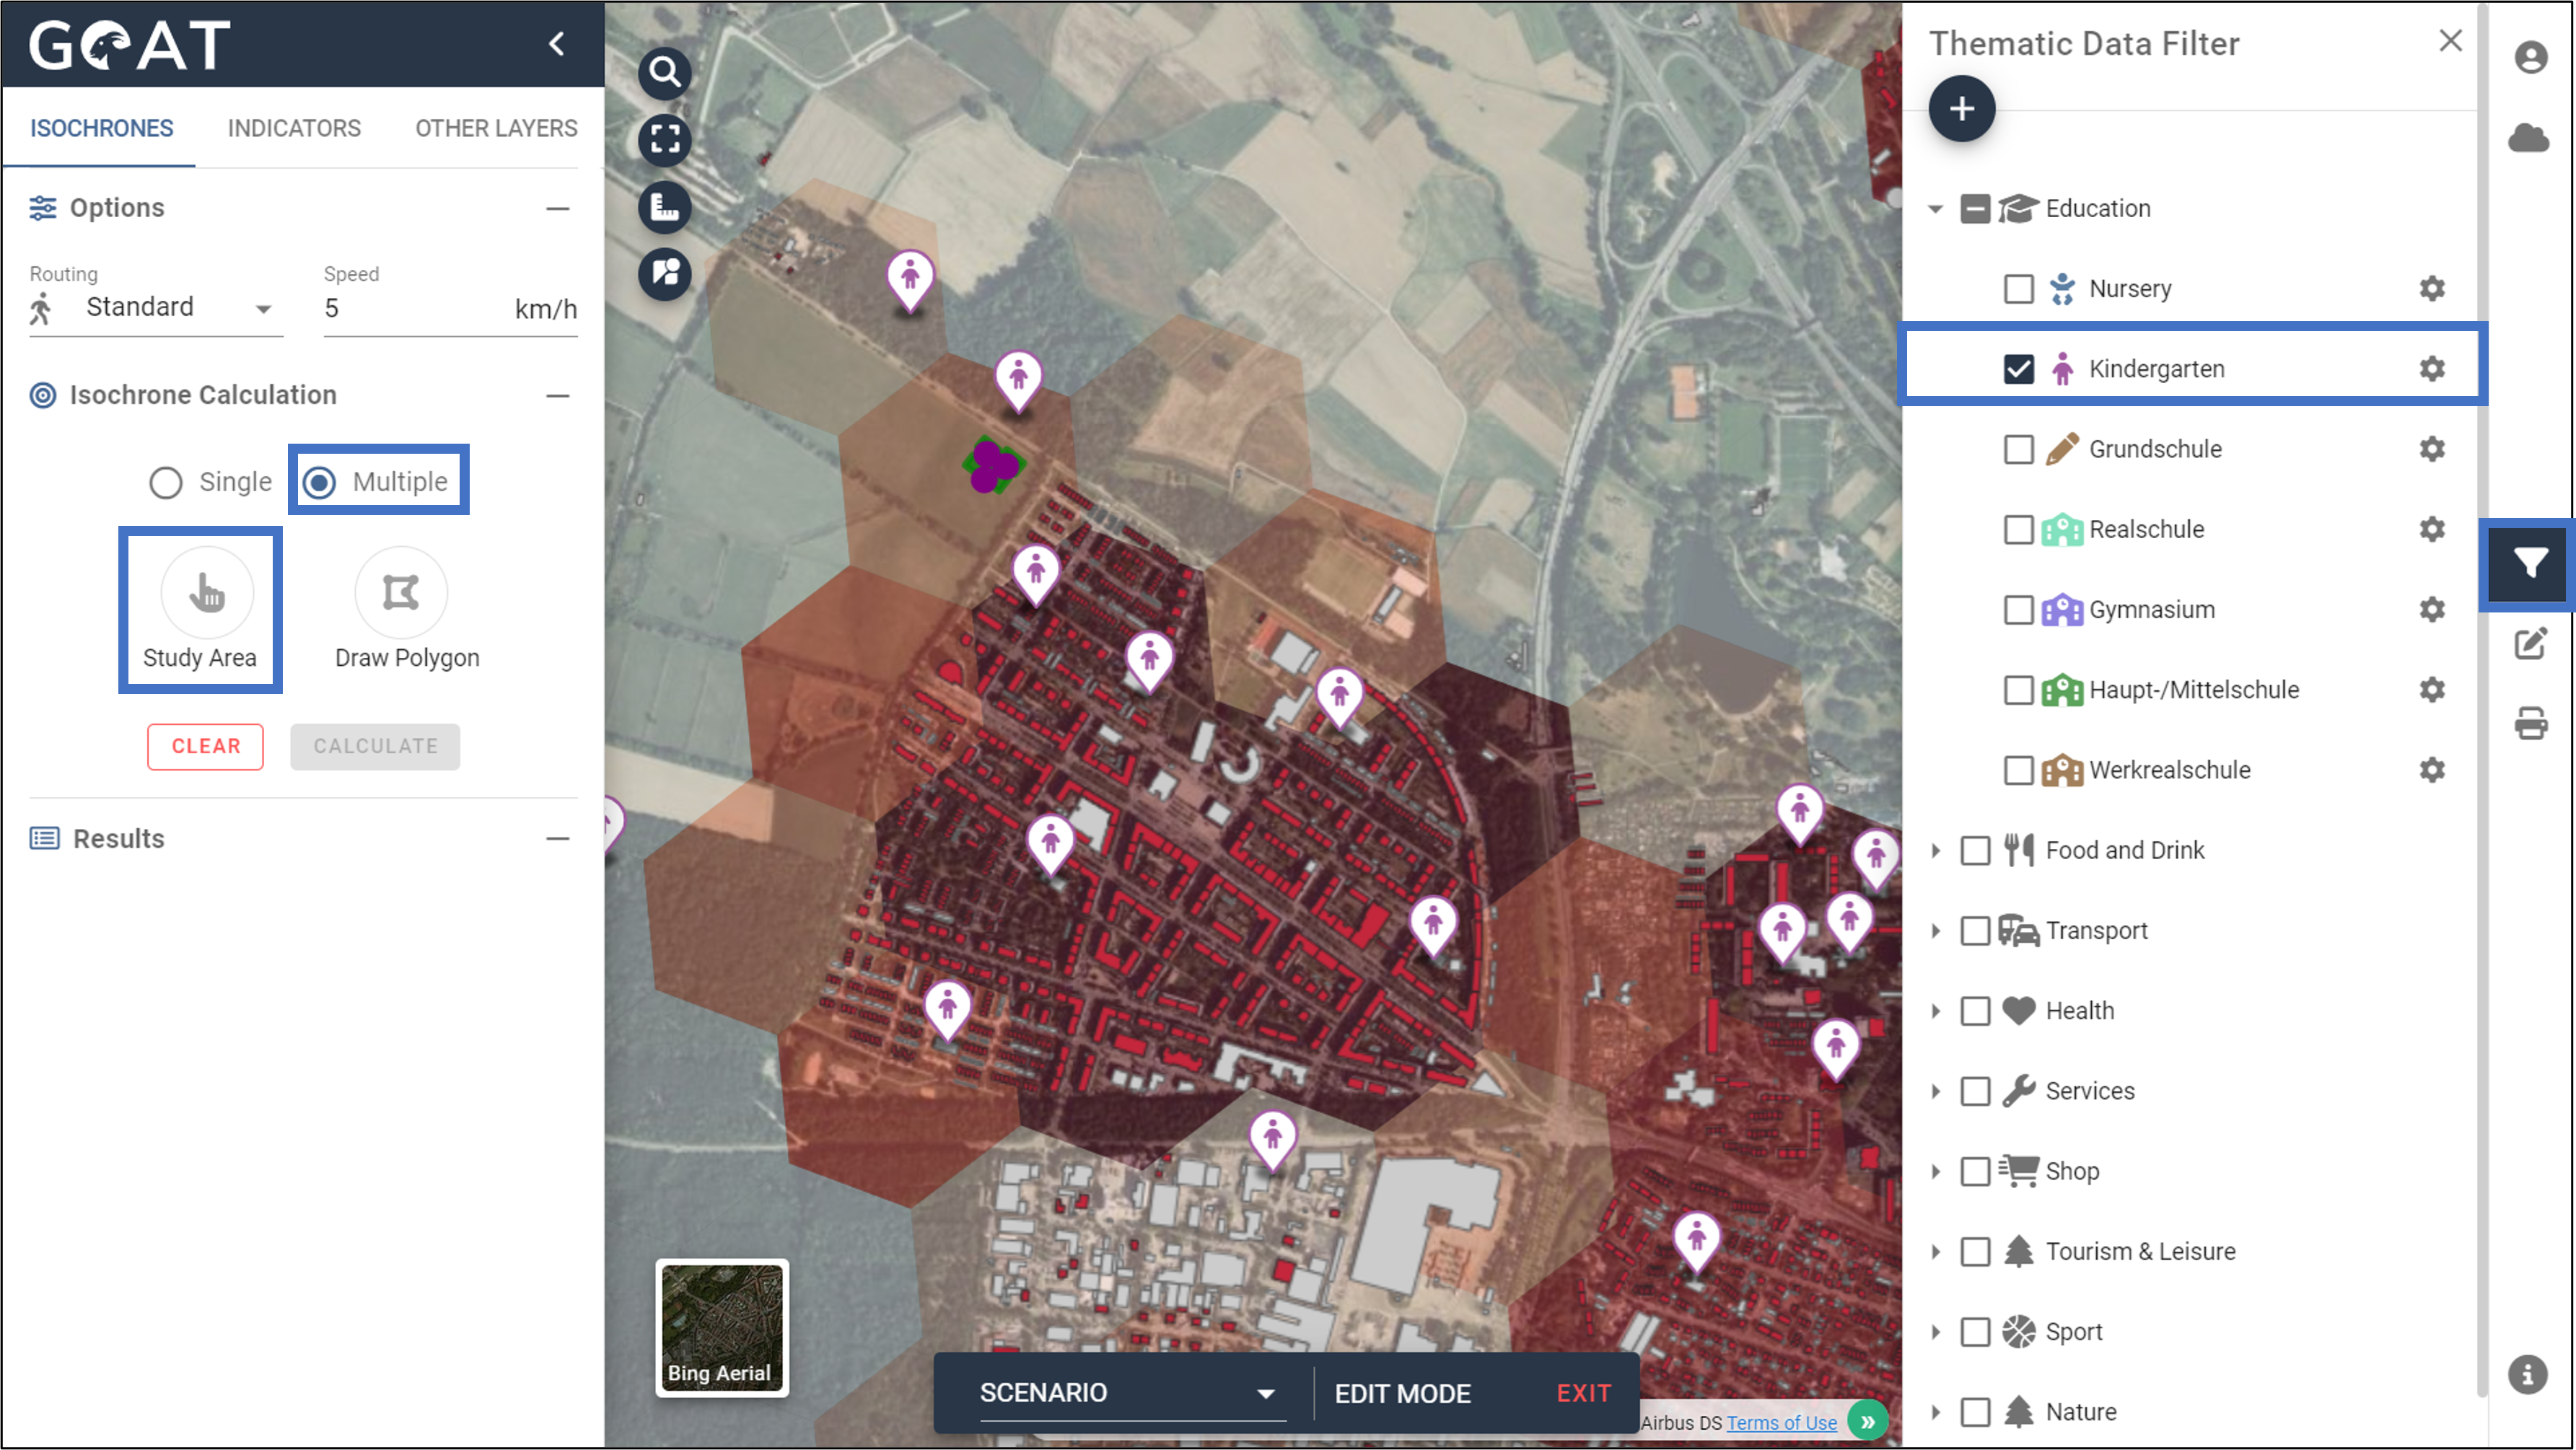
Select the district on the map where you have carried out the redensification with a mouse click.
Click on “Calculate.”

- The resulting multi-isochrones show the catchment areas of the kindergartens (here for the mode “pedestrian” with 10-minutes catchment area). In this example case, it can be seen in the map that the new population is just at the border of the catchment area and thus has to walk a good 10 minutes to the nearest kindergarten.
- The travel time slider can be adjusted interactively. The multi-isochrones are dynamically reacting to the changes.