Description of the feature
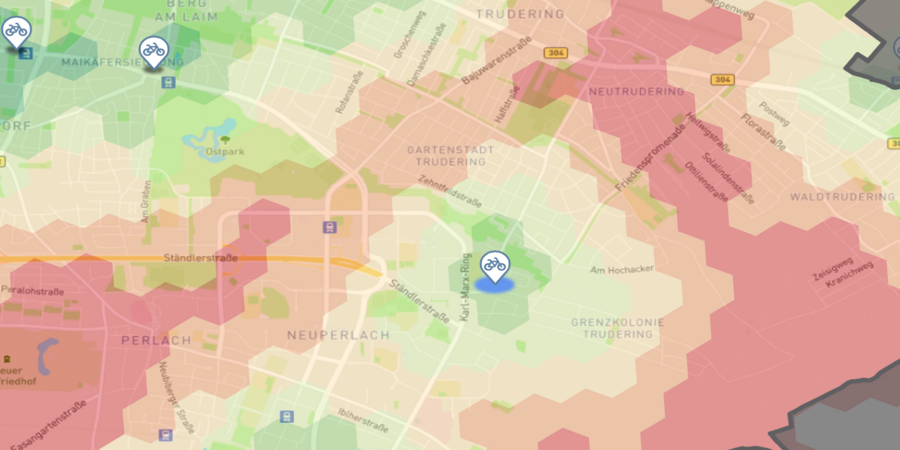
GOAT allows you to develop your own location planning scenarios, for example, add a new supermarket or school and determine the impact on accessibility using heat maps and multi-isochrones.
Possible use cases (planning questions)
- How does accessibility to supermarkets in a neighbourhood change when the location of a supermarket is changed?
- How does accessibility to schools change when a new school is added?
- How well are the kindergartens distributed throughout the city? Where would be a good location for a new kindergarten?
Video Tutorial
Step-by-step tutorial for the exemplary planning task
1 Scenario on accessibility to kindergartens
1.1 Planning questions
- How well are kindergartens currently distributed across the city?
- In which parts of the city are there deficits in pedestrian accessibility?
- And how could these be remedied?
- Where would be a good location for a new kindergarten?
1.2 Step-by-Step guide
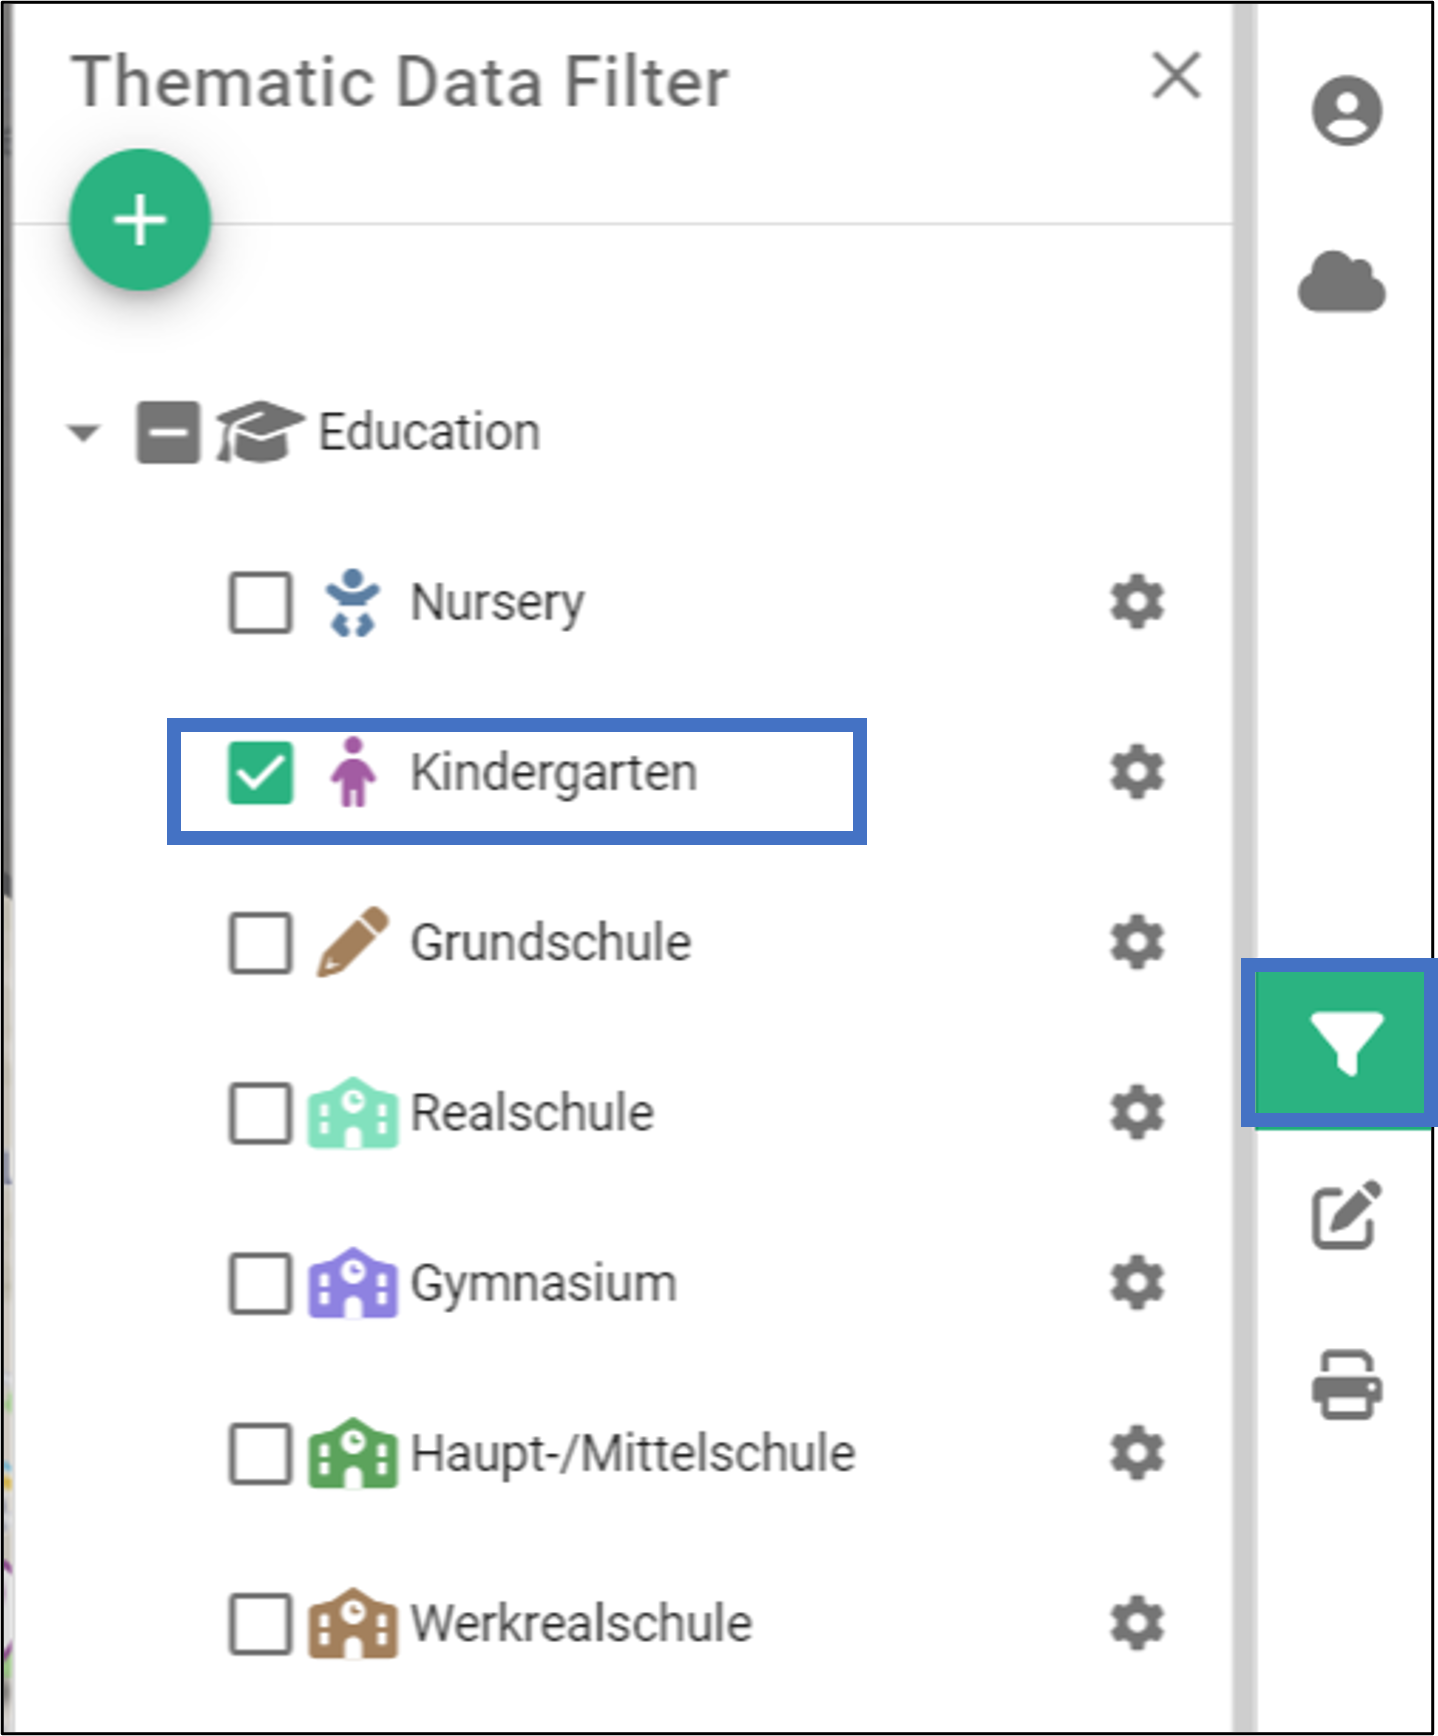
- Select the kindergartens as Thematic Data.
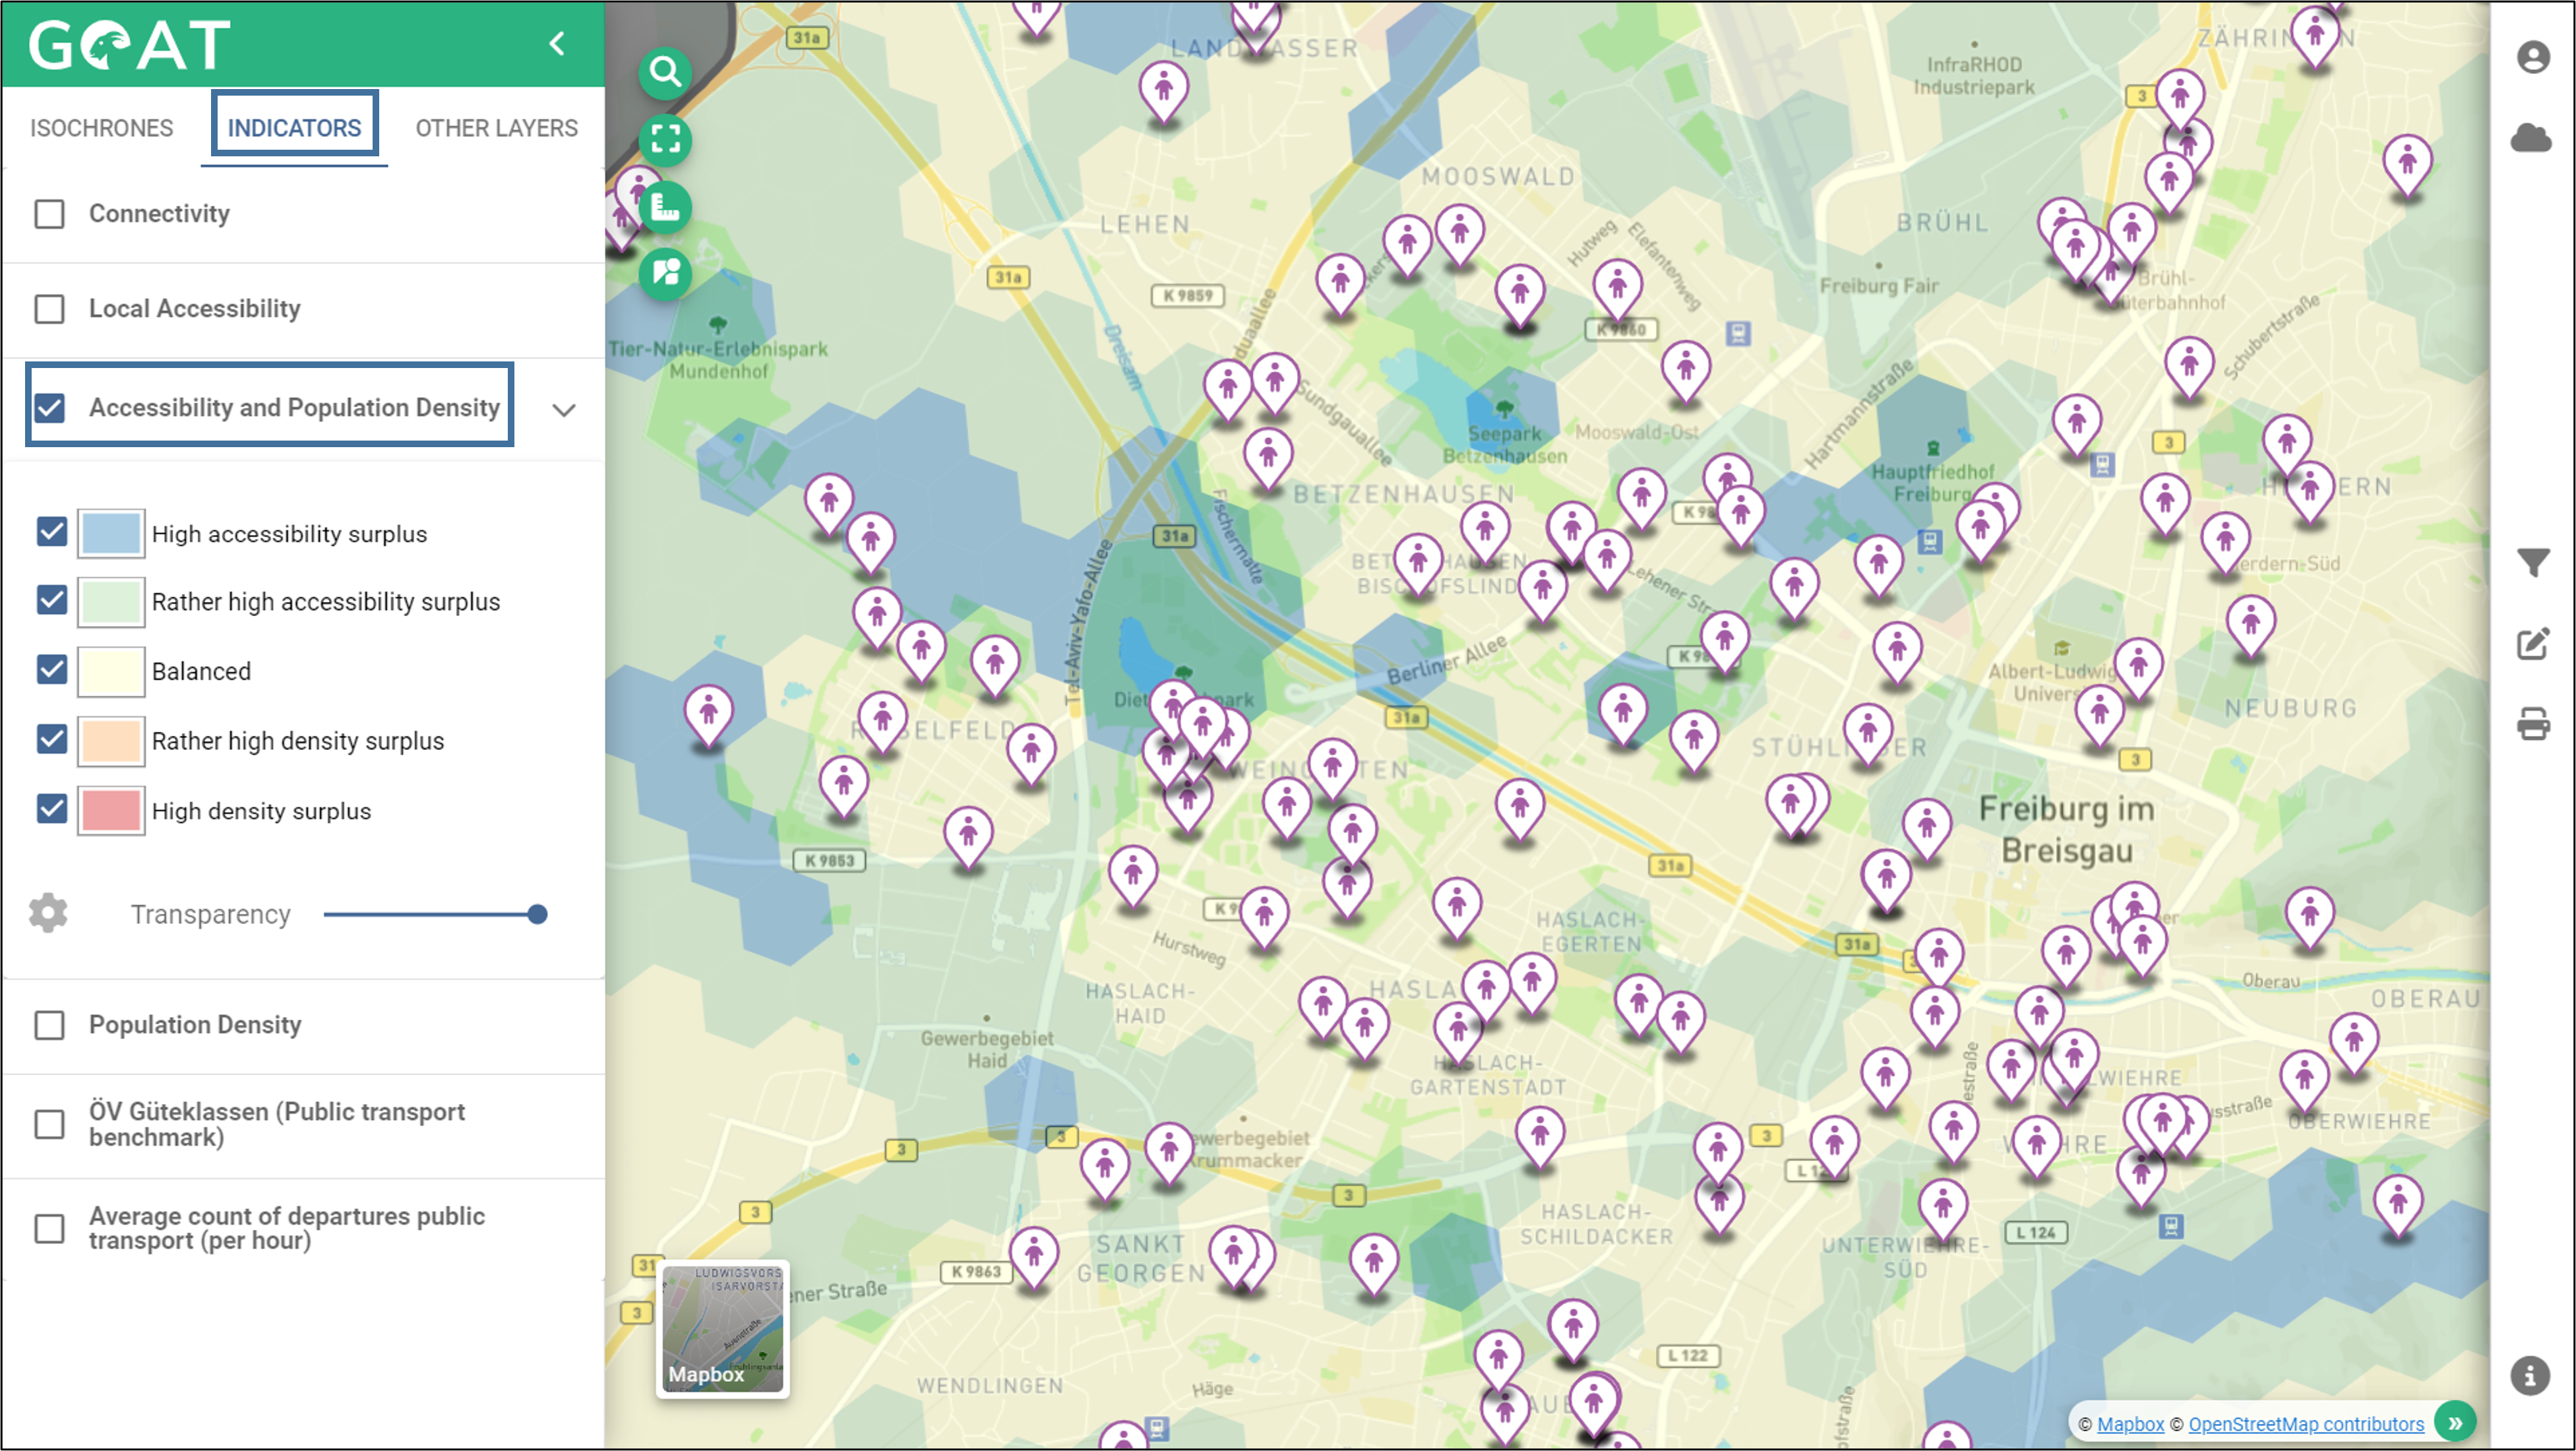
- Display the indicator “Accessibility and Population Density.” This shows how well the walking accessibility to the selected destinations is spatially distributed over the population. The red coloring indicates spaces that are currently undersupplied.
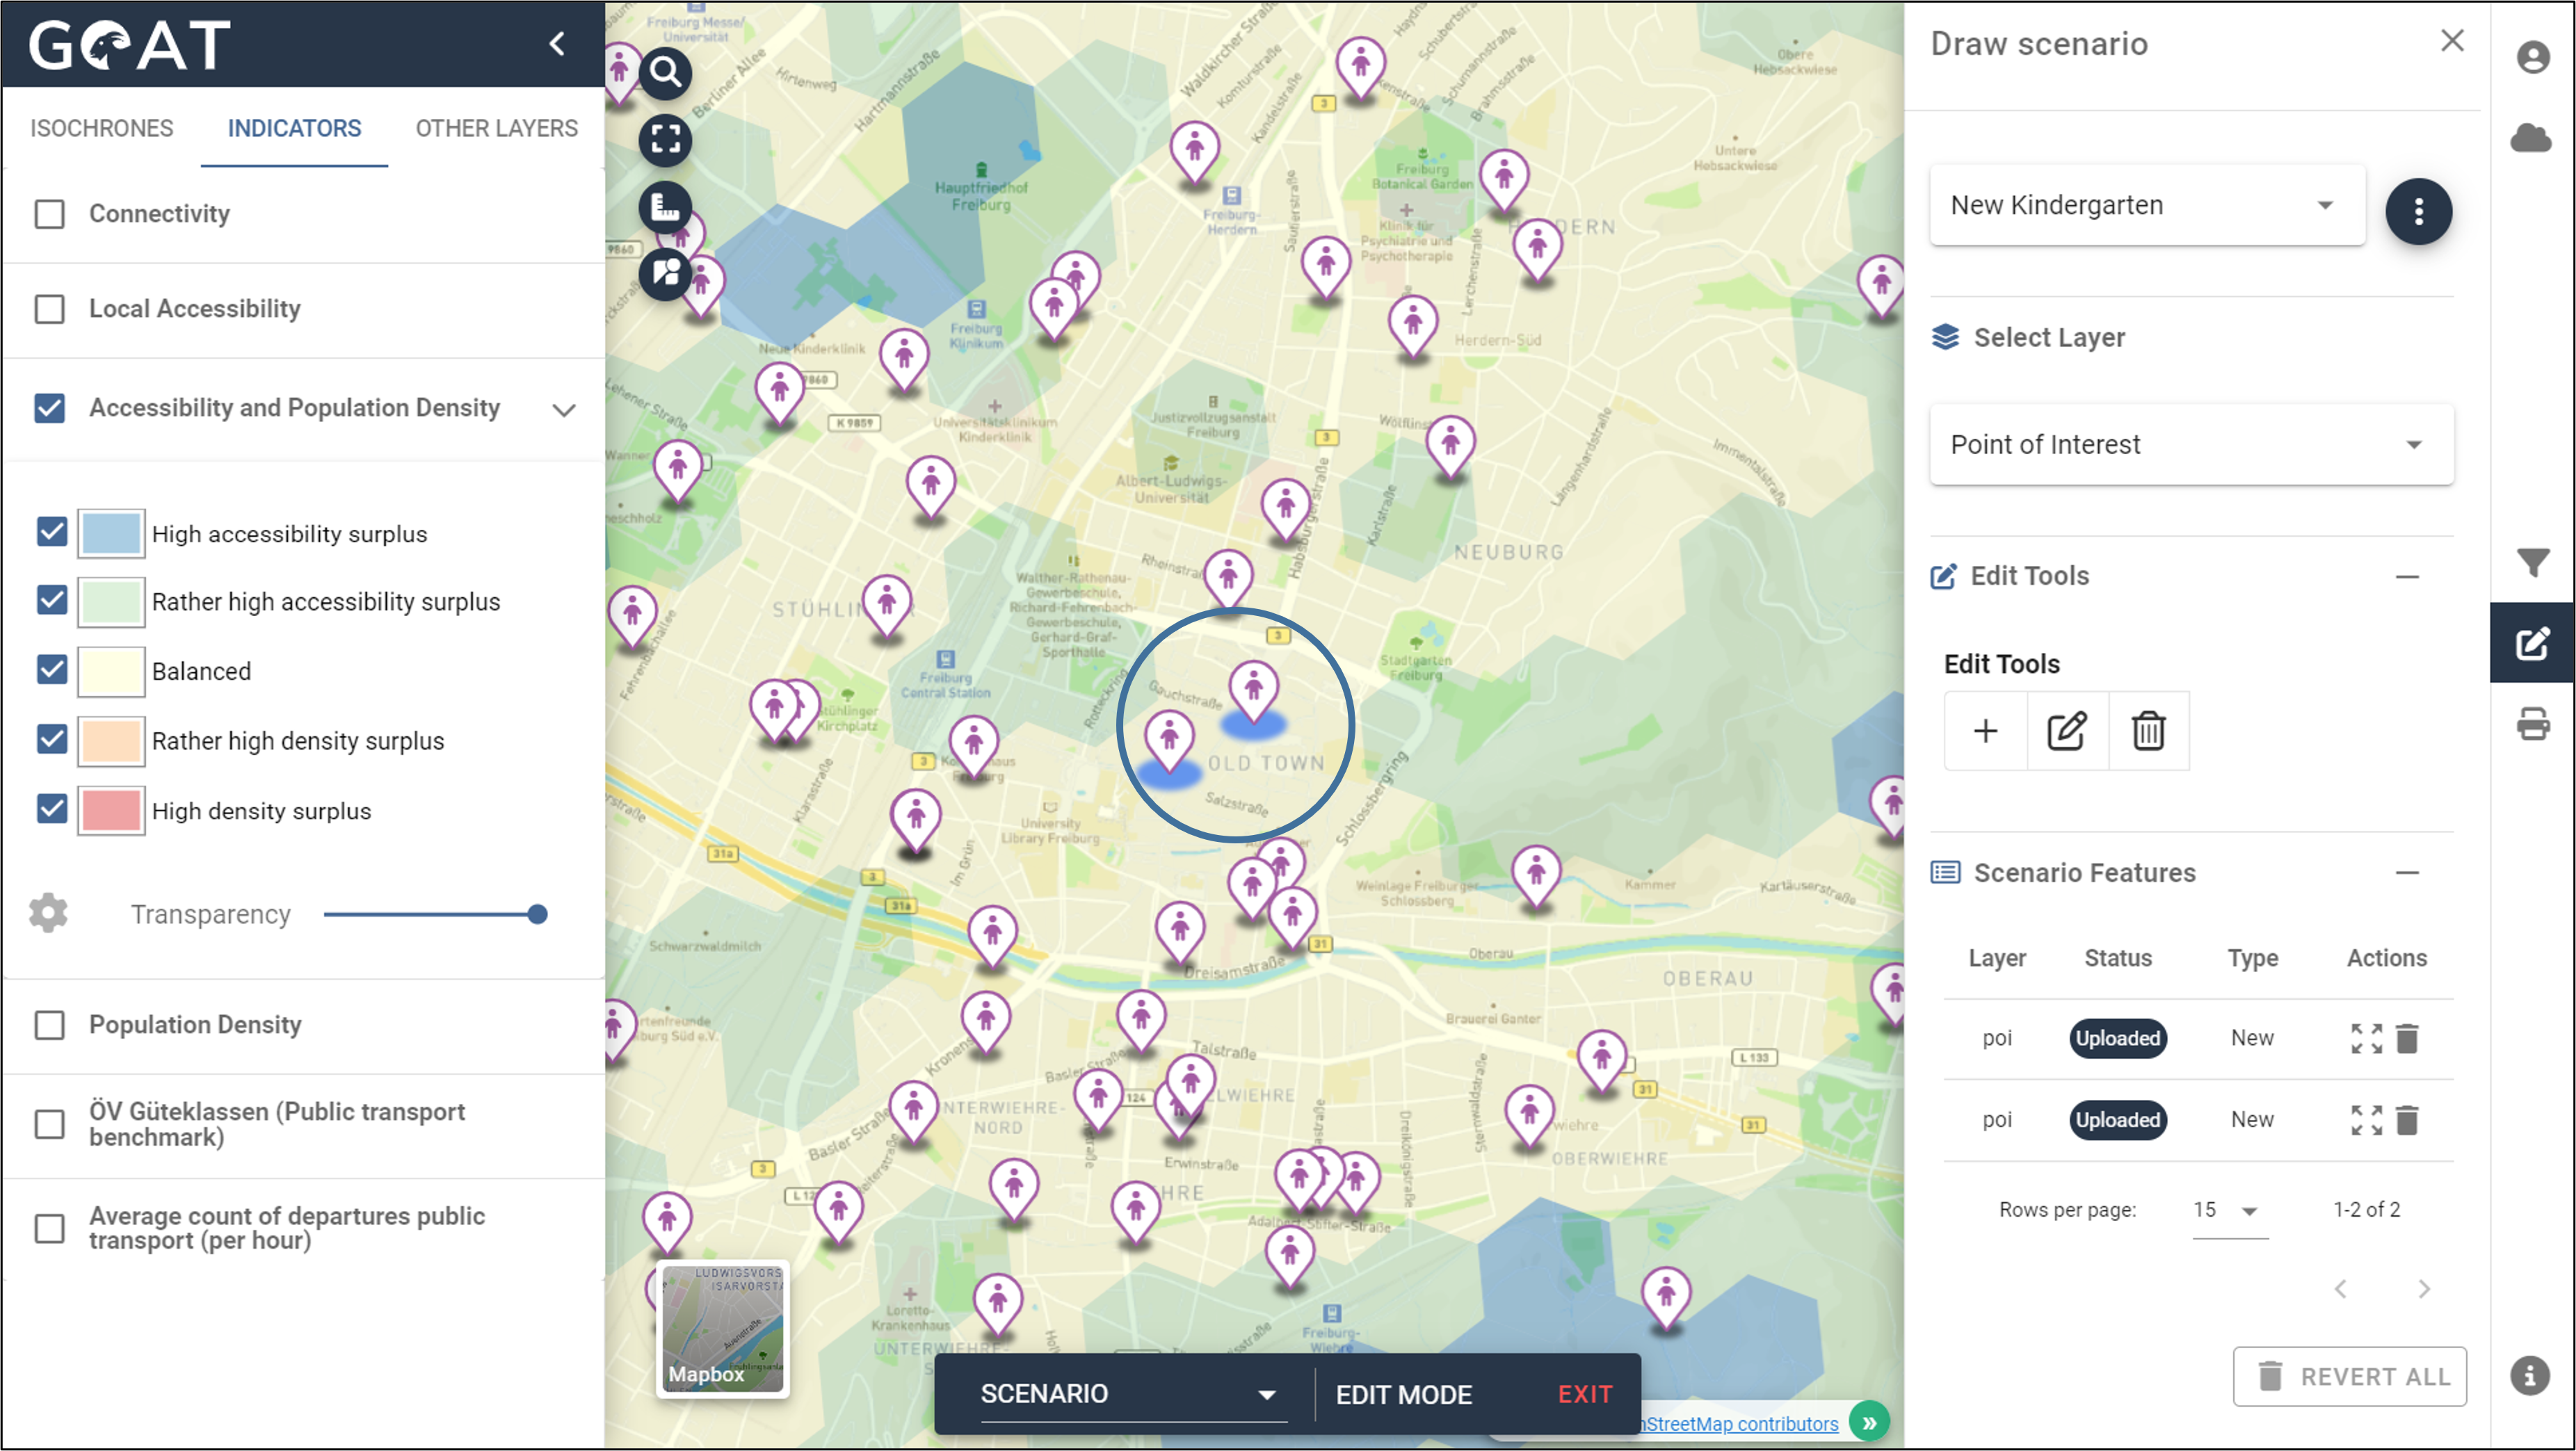
- Now go to the menu for scenario development and create a new scenario.
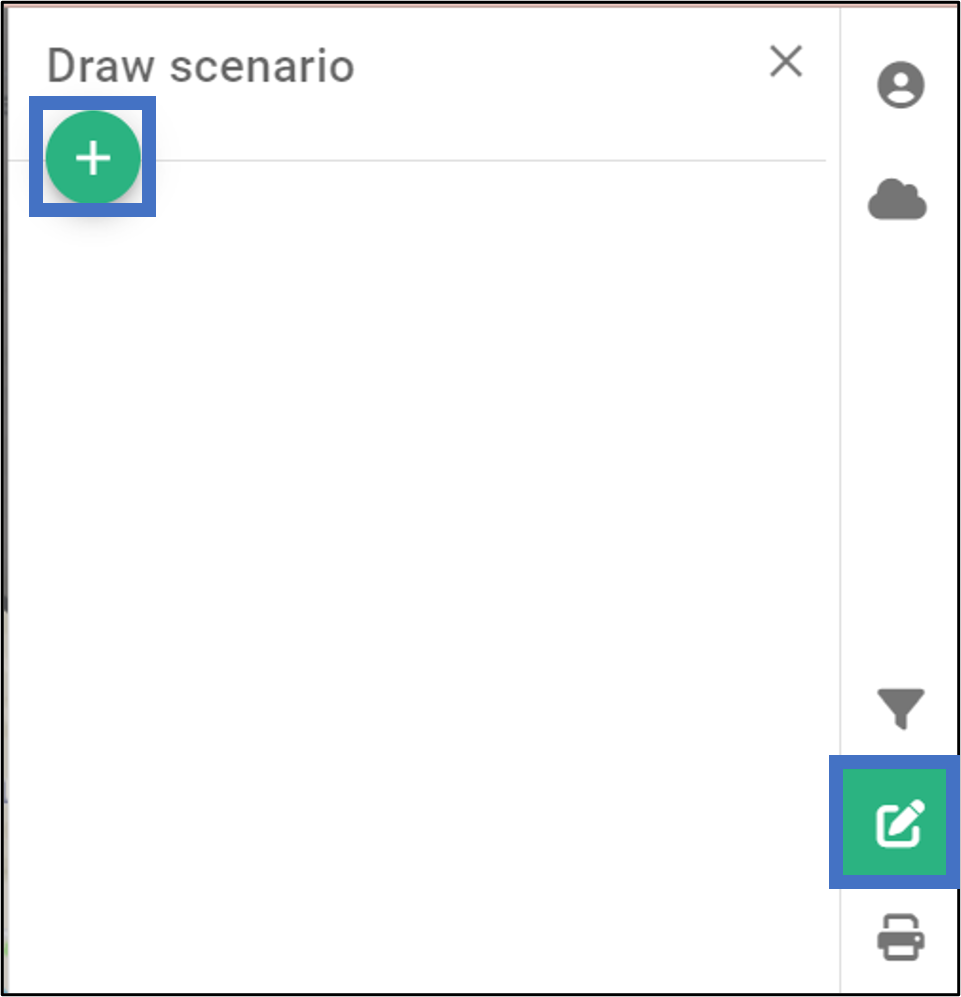
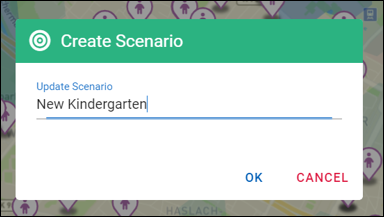
- Give the scenario a name and click “OK”.
- Select the layer you want to edit, in this case the “Point of Interest” Layer.
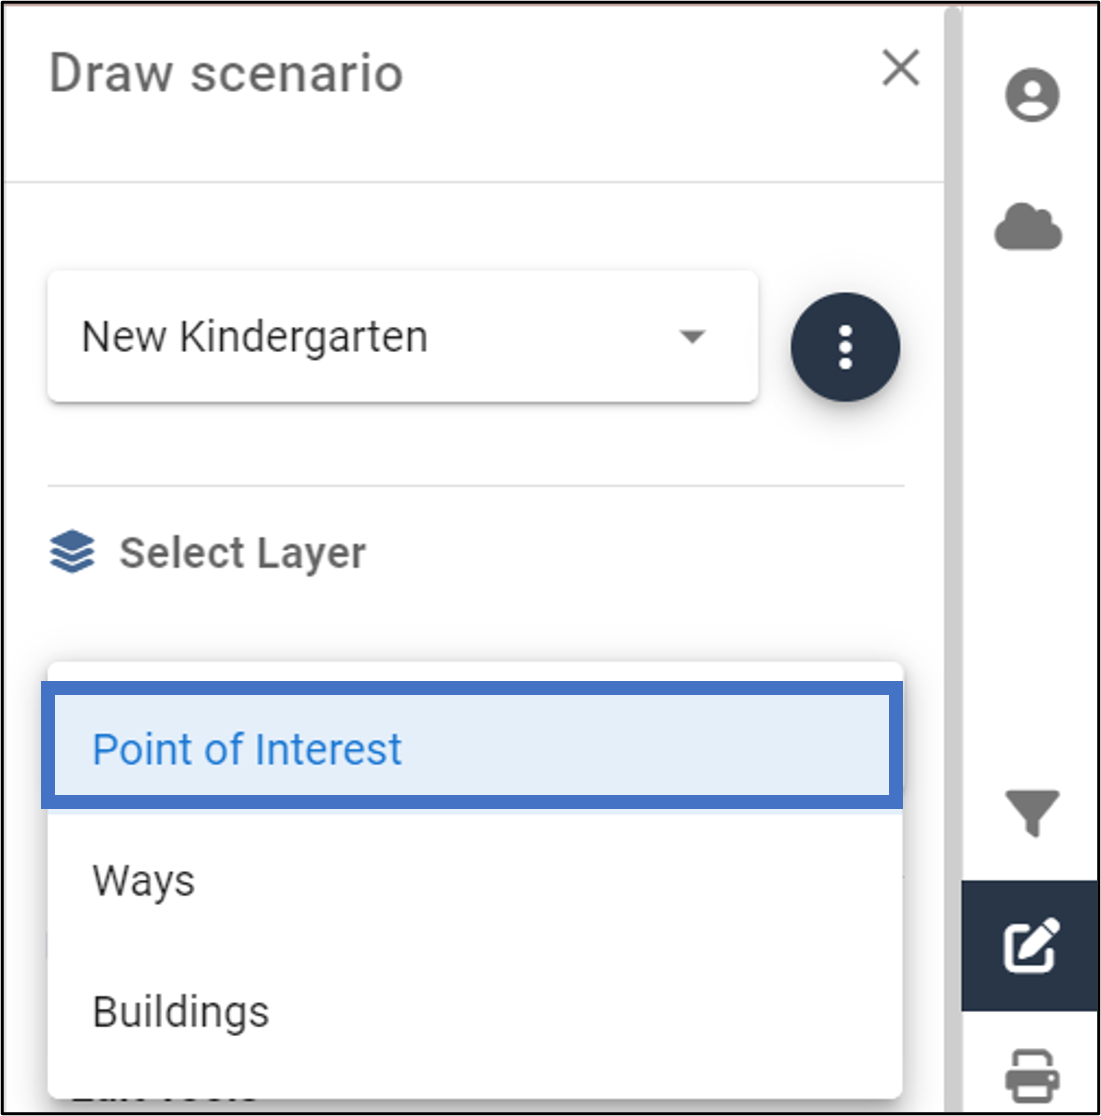
You’re now in the scenario mode. To indicate the new mode, the menu color changes from green to dark blue.
Edit the kindergartens (move existing kindergartens or add new kindergartens) to cover the neighborhoods with accessibility deficits.
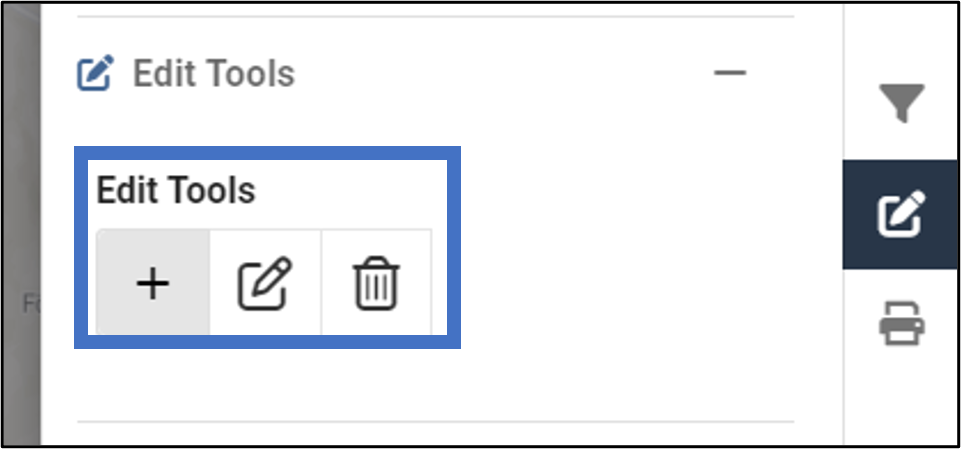
- For example, add a new kindergarten.
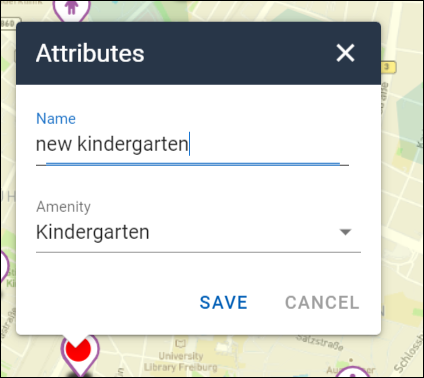
- The “Comparison of Accessibility and Population Density” heatmap automatically refreshed. The modified kindergartens are now included in the calculation.
