Description of the feature
GOAT allows you to develop your own scenarios, such as network modifications or building a new bridge. The developed scenario can be added to the current network, and changes in accessibility can be evaluated using isochrones.
Possible use cases (planning questions)
- How does the construction of a new bicycle bridge across the river change accessibility?
- Which variation of a new bike path provides access to the highest number of residents?
Video Tutorial
Step-by-step tutorial for the exemplary planning task
1 Scenario for a new bicycle bridge
1.1 Planning question
How does the construction of a new bicycle bridge across the river change accessibility?
1.2 Step-by-Step guide
- Go to the menu for scenario development and create a new scenario.
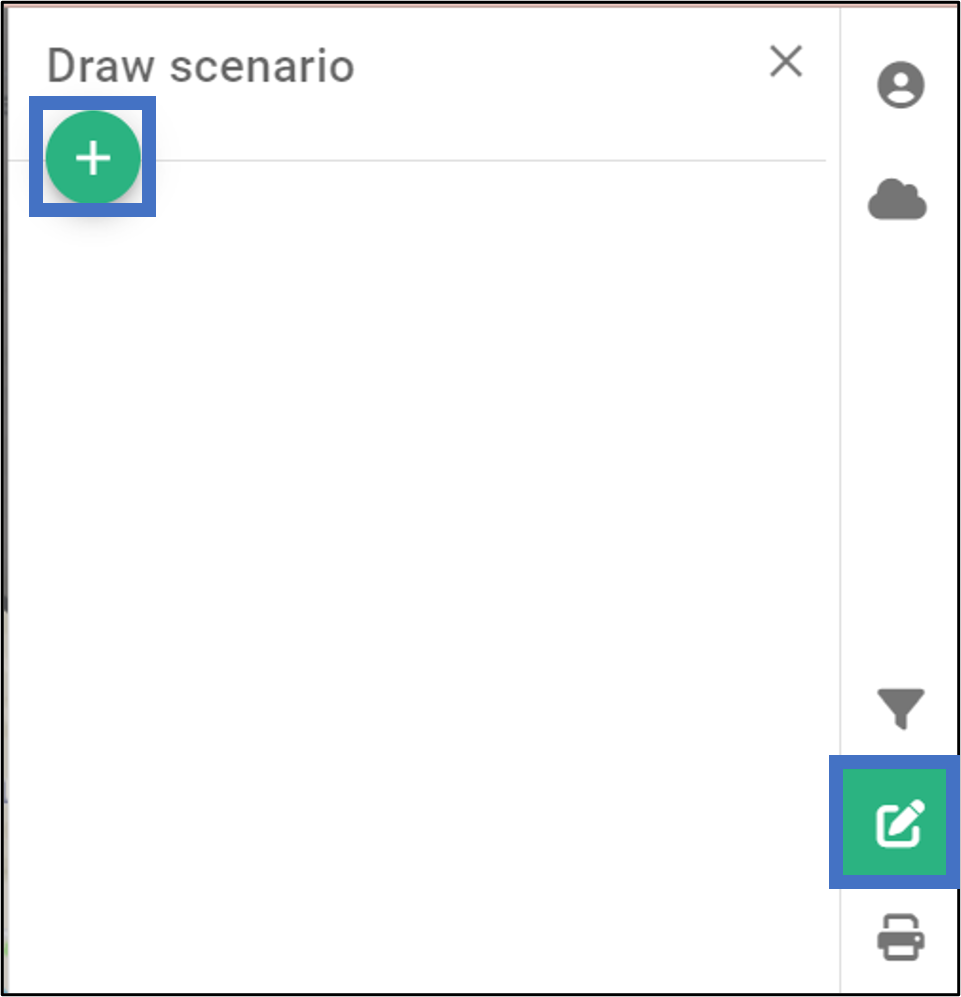
- Give the scenario a name and click “OK”.

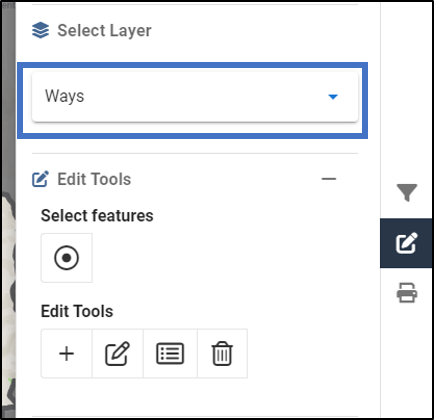
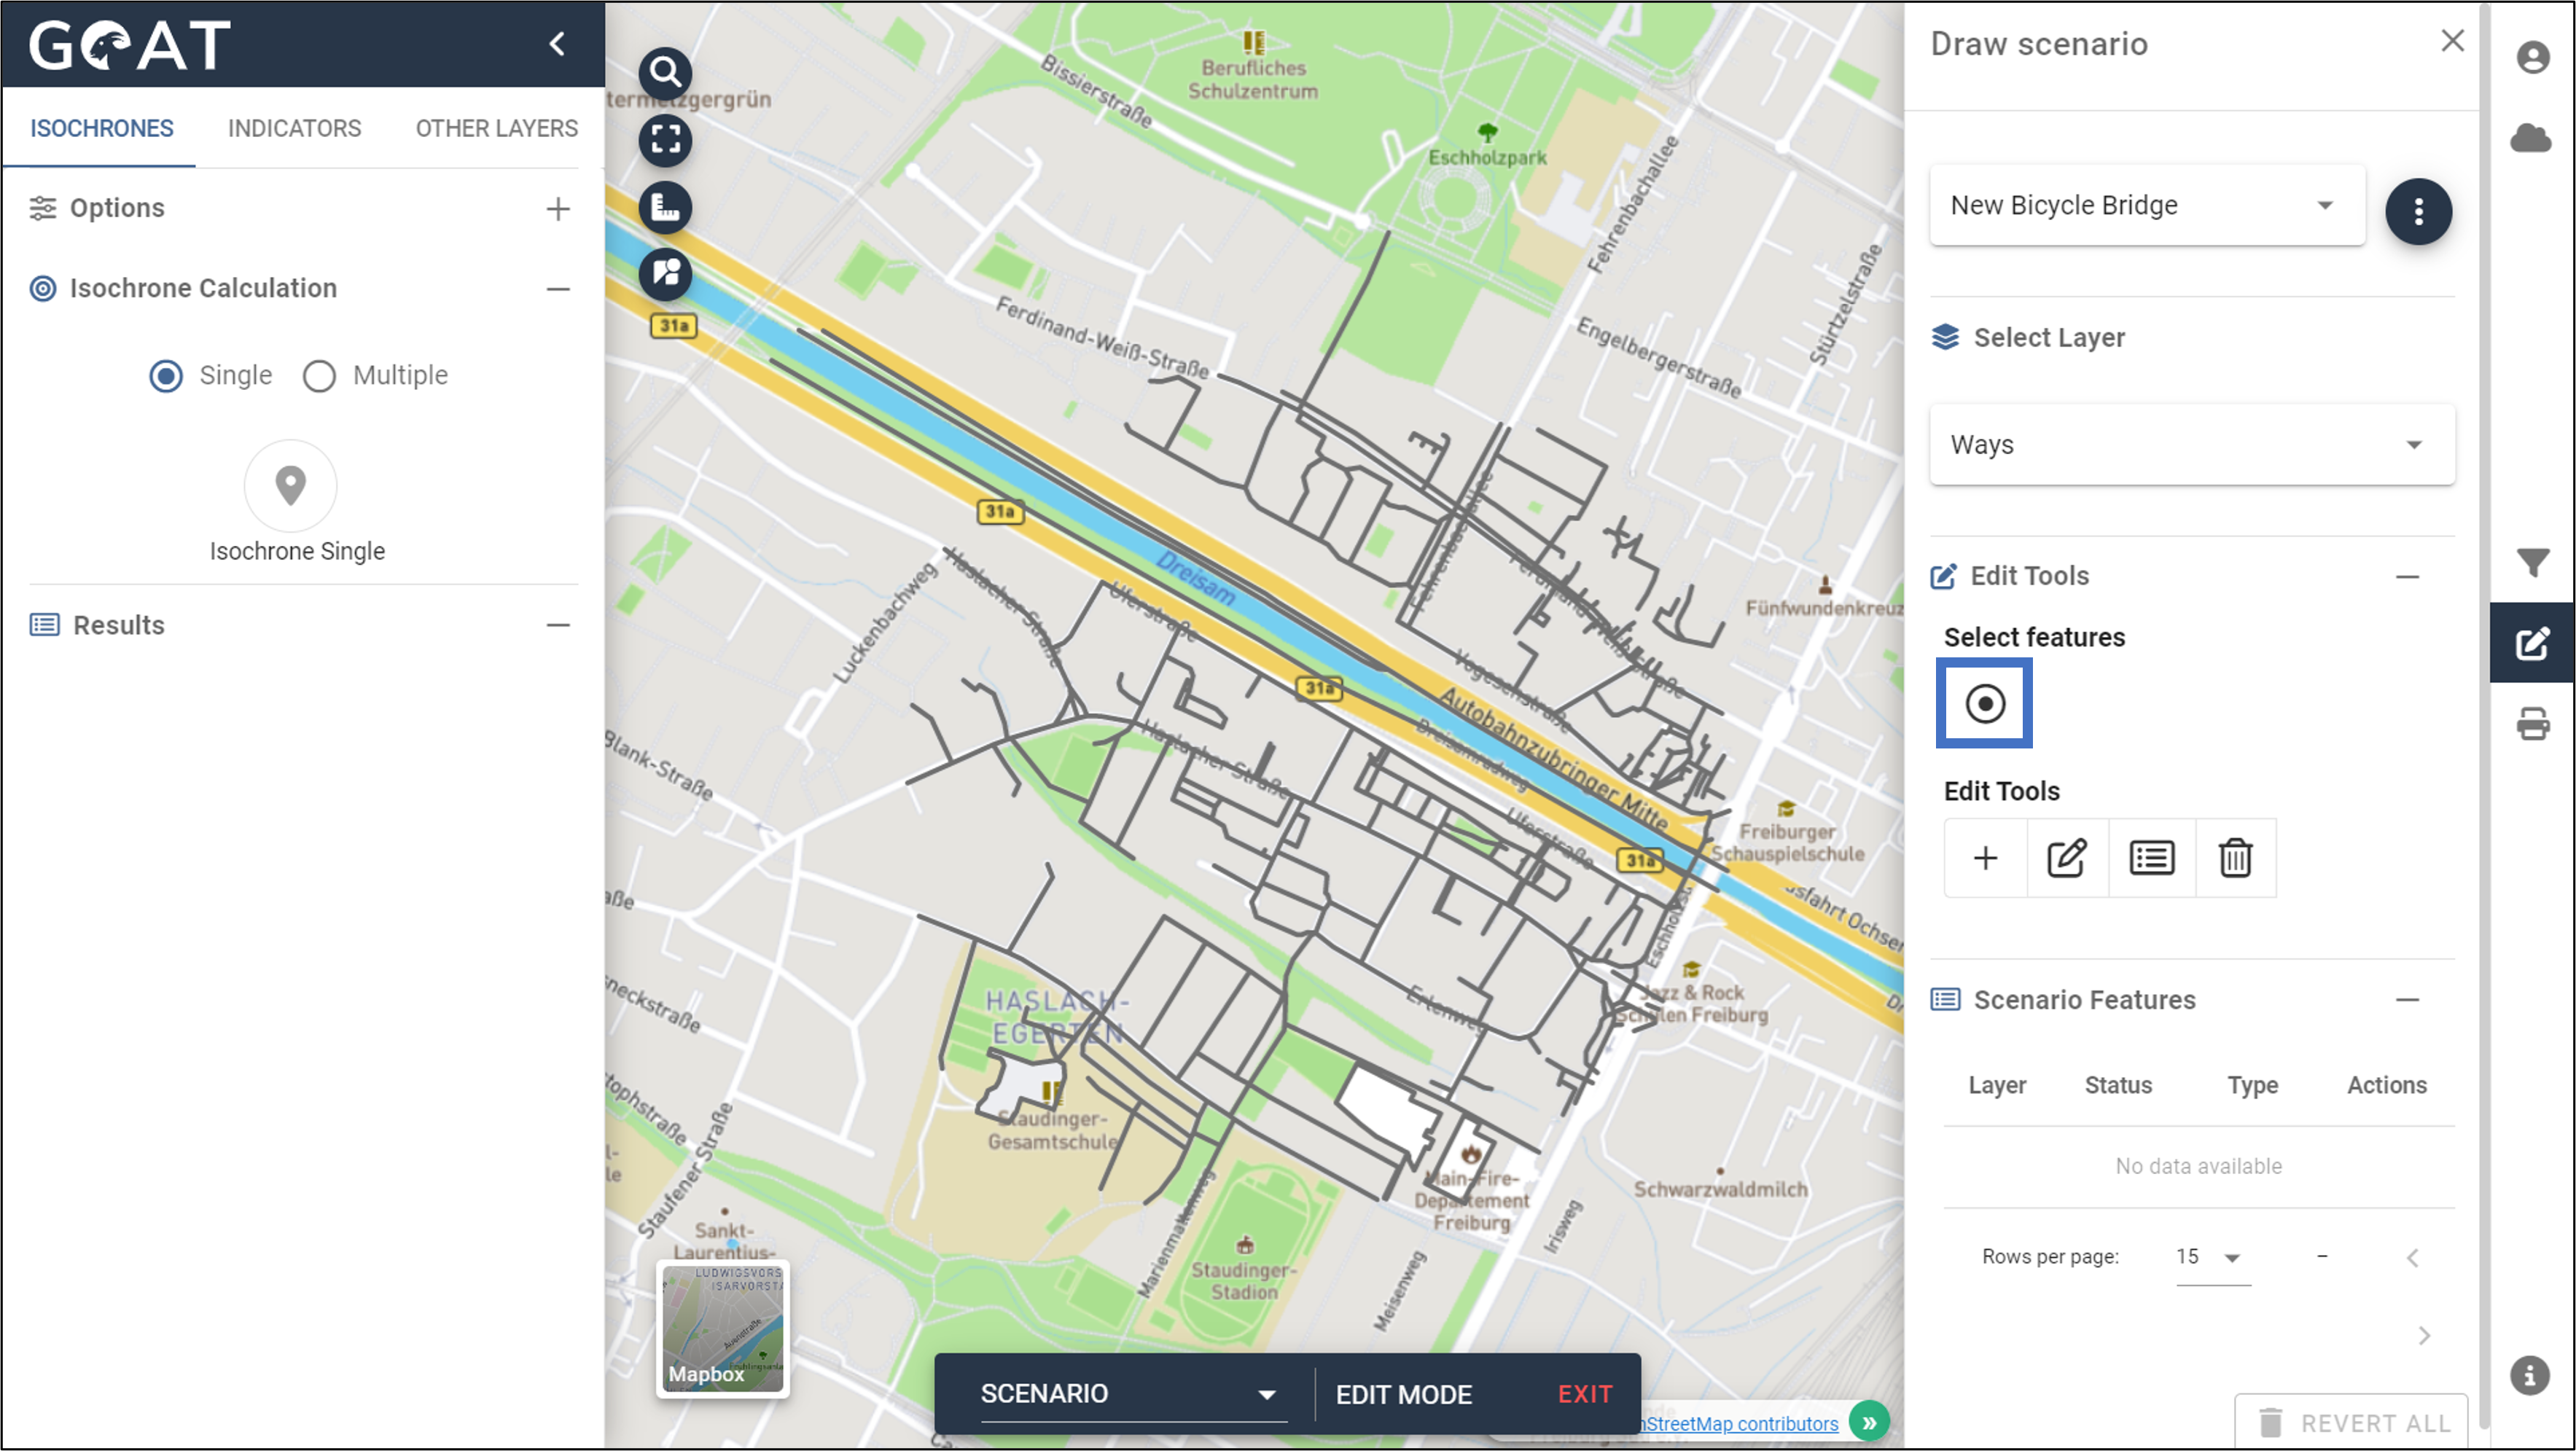
- Select the layer you want to edit, in this case the “Ways” Layer.
You’re now in the scenario mode. To indicate the new mode, the menu color changes from green to dark blue.
Zoom to the location where you want to build a new bicycle bridge and select the surrounding road network using the circle tool.
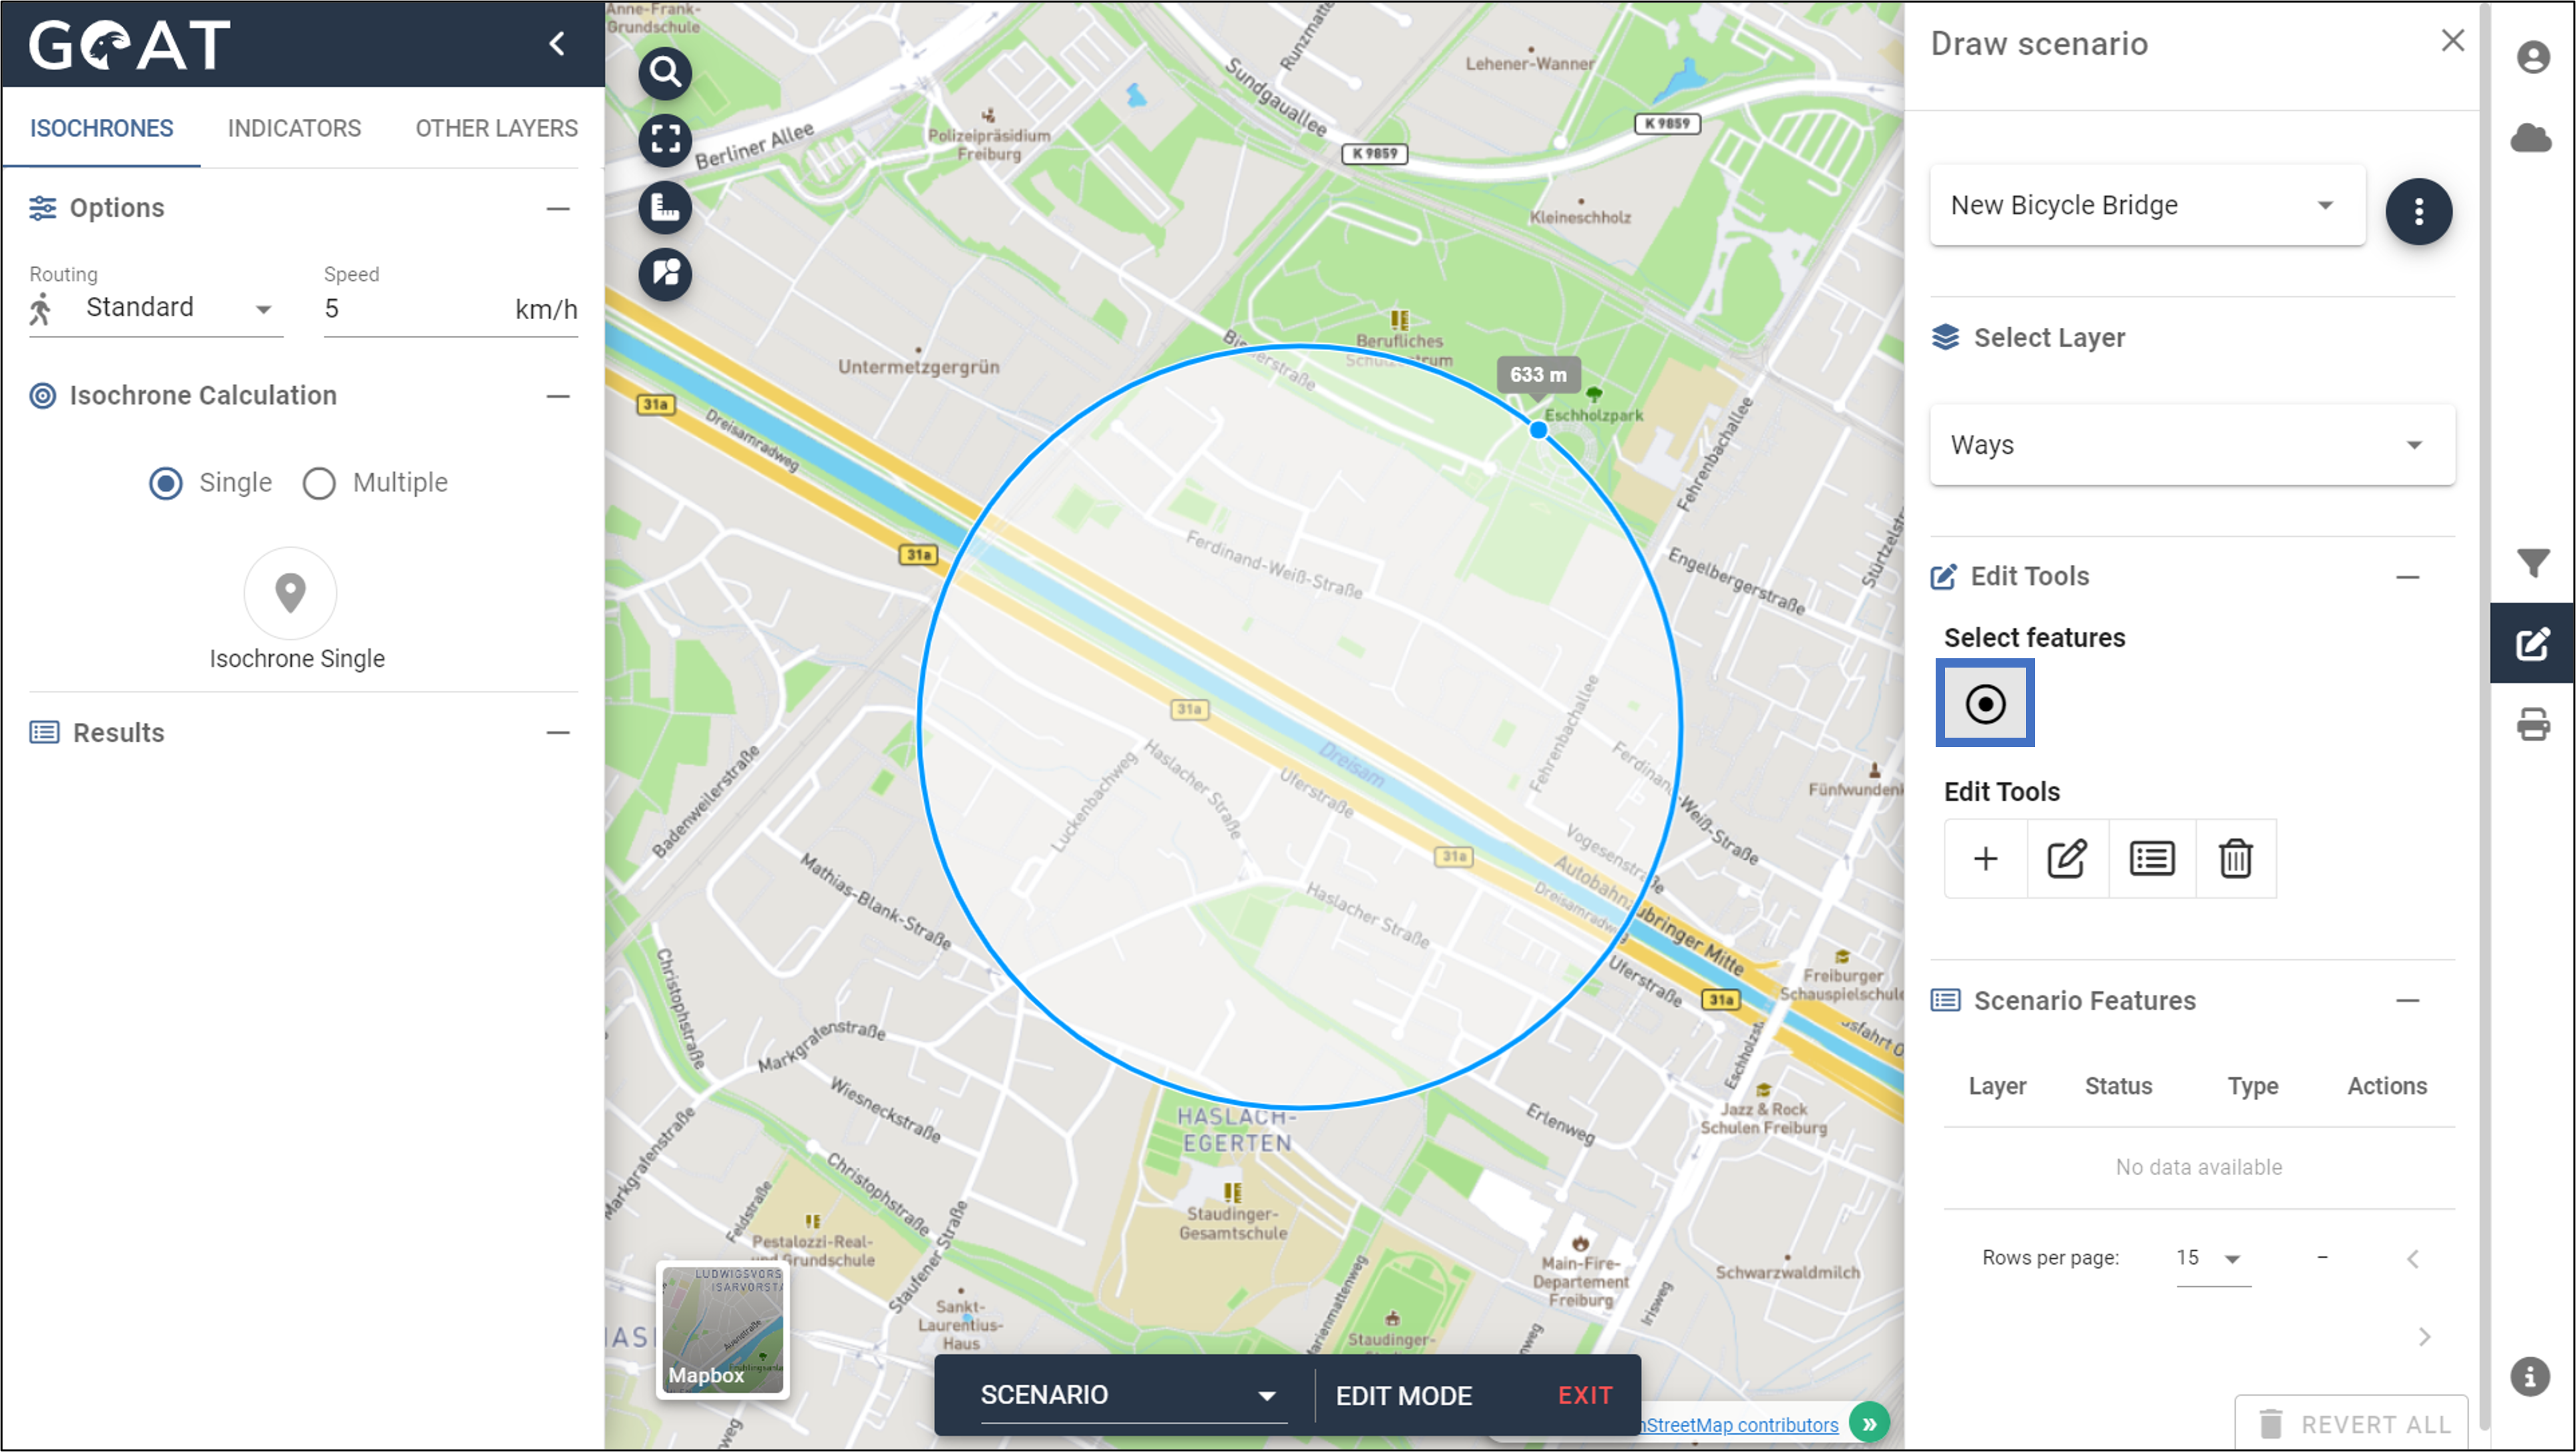
- The existing path network will be displayed.
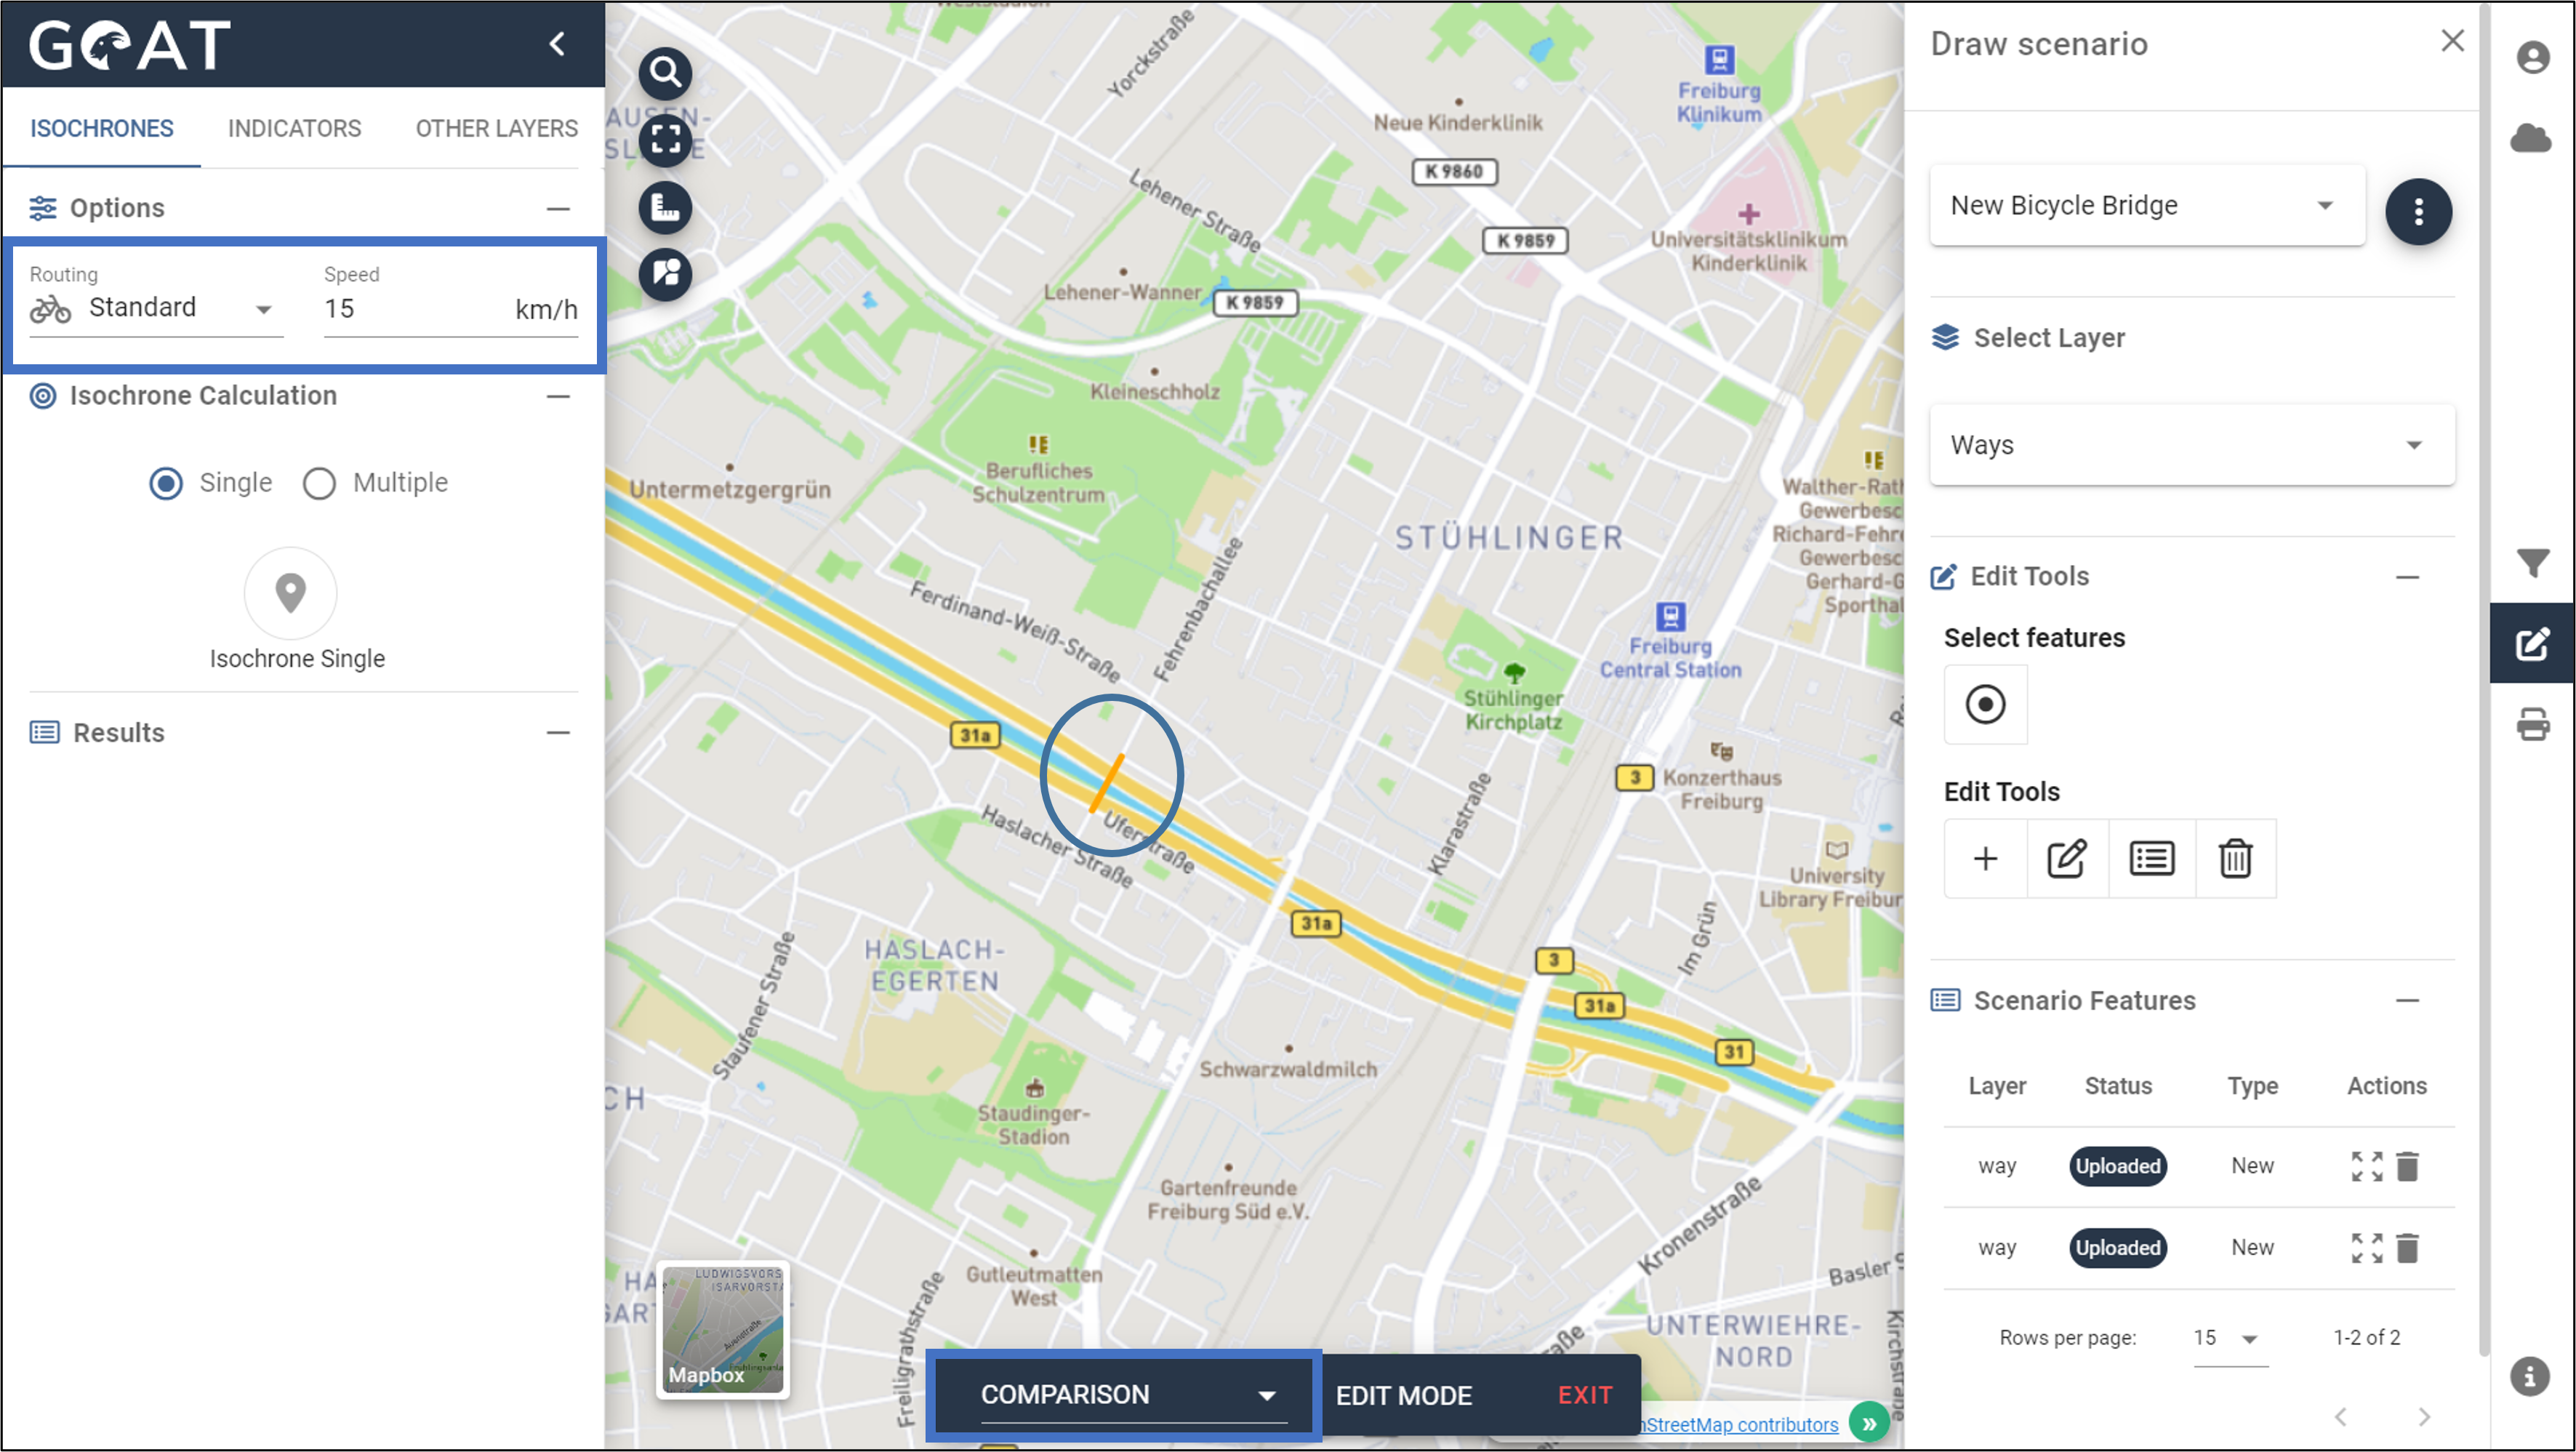
- Draw a new route connection at the desired location, select “Bridge” as the route type and click “Save”. The drawn paths are uploaded automatically into the database and are listed in the table on the bottom right.

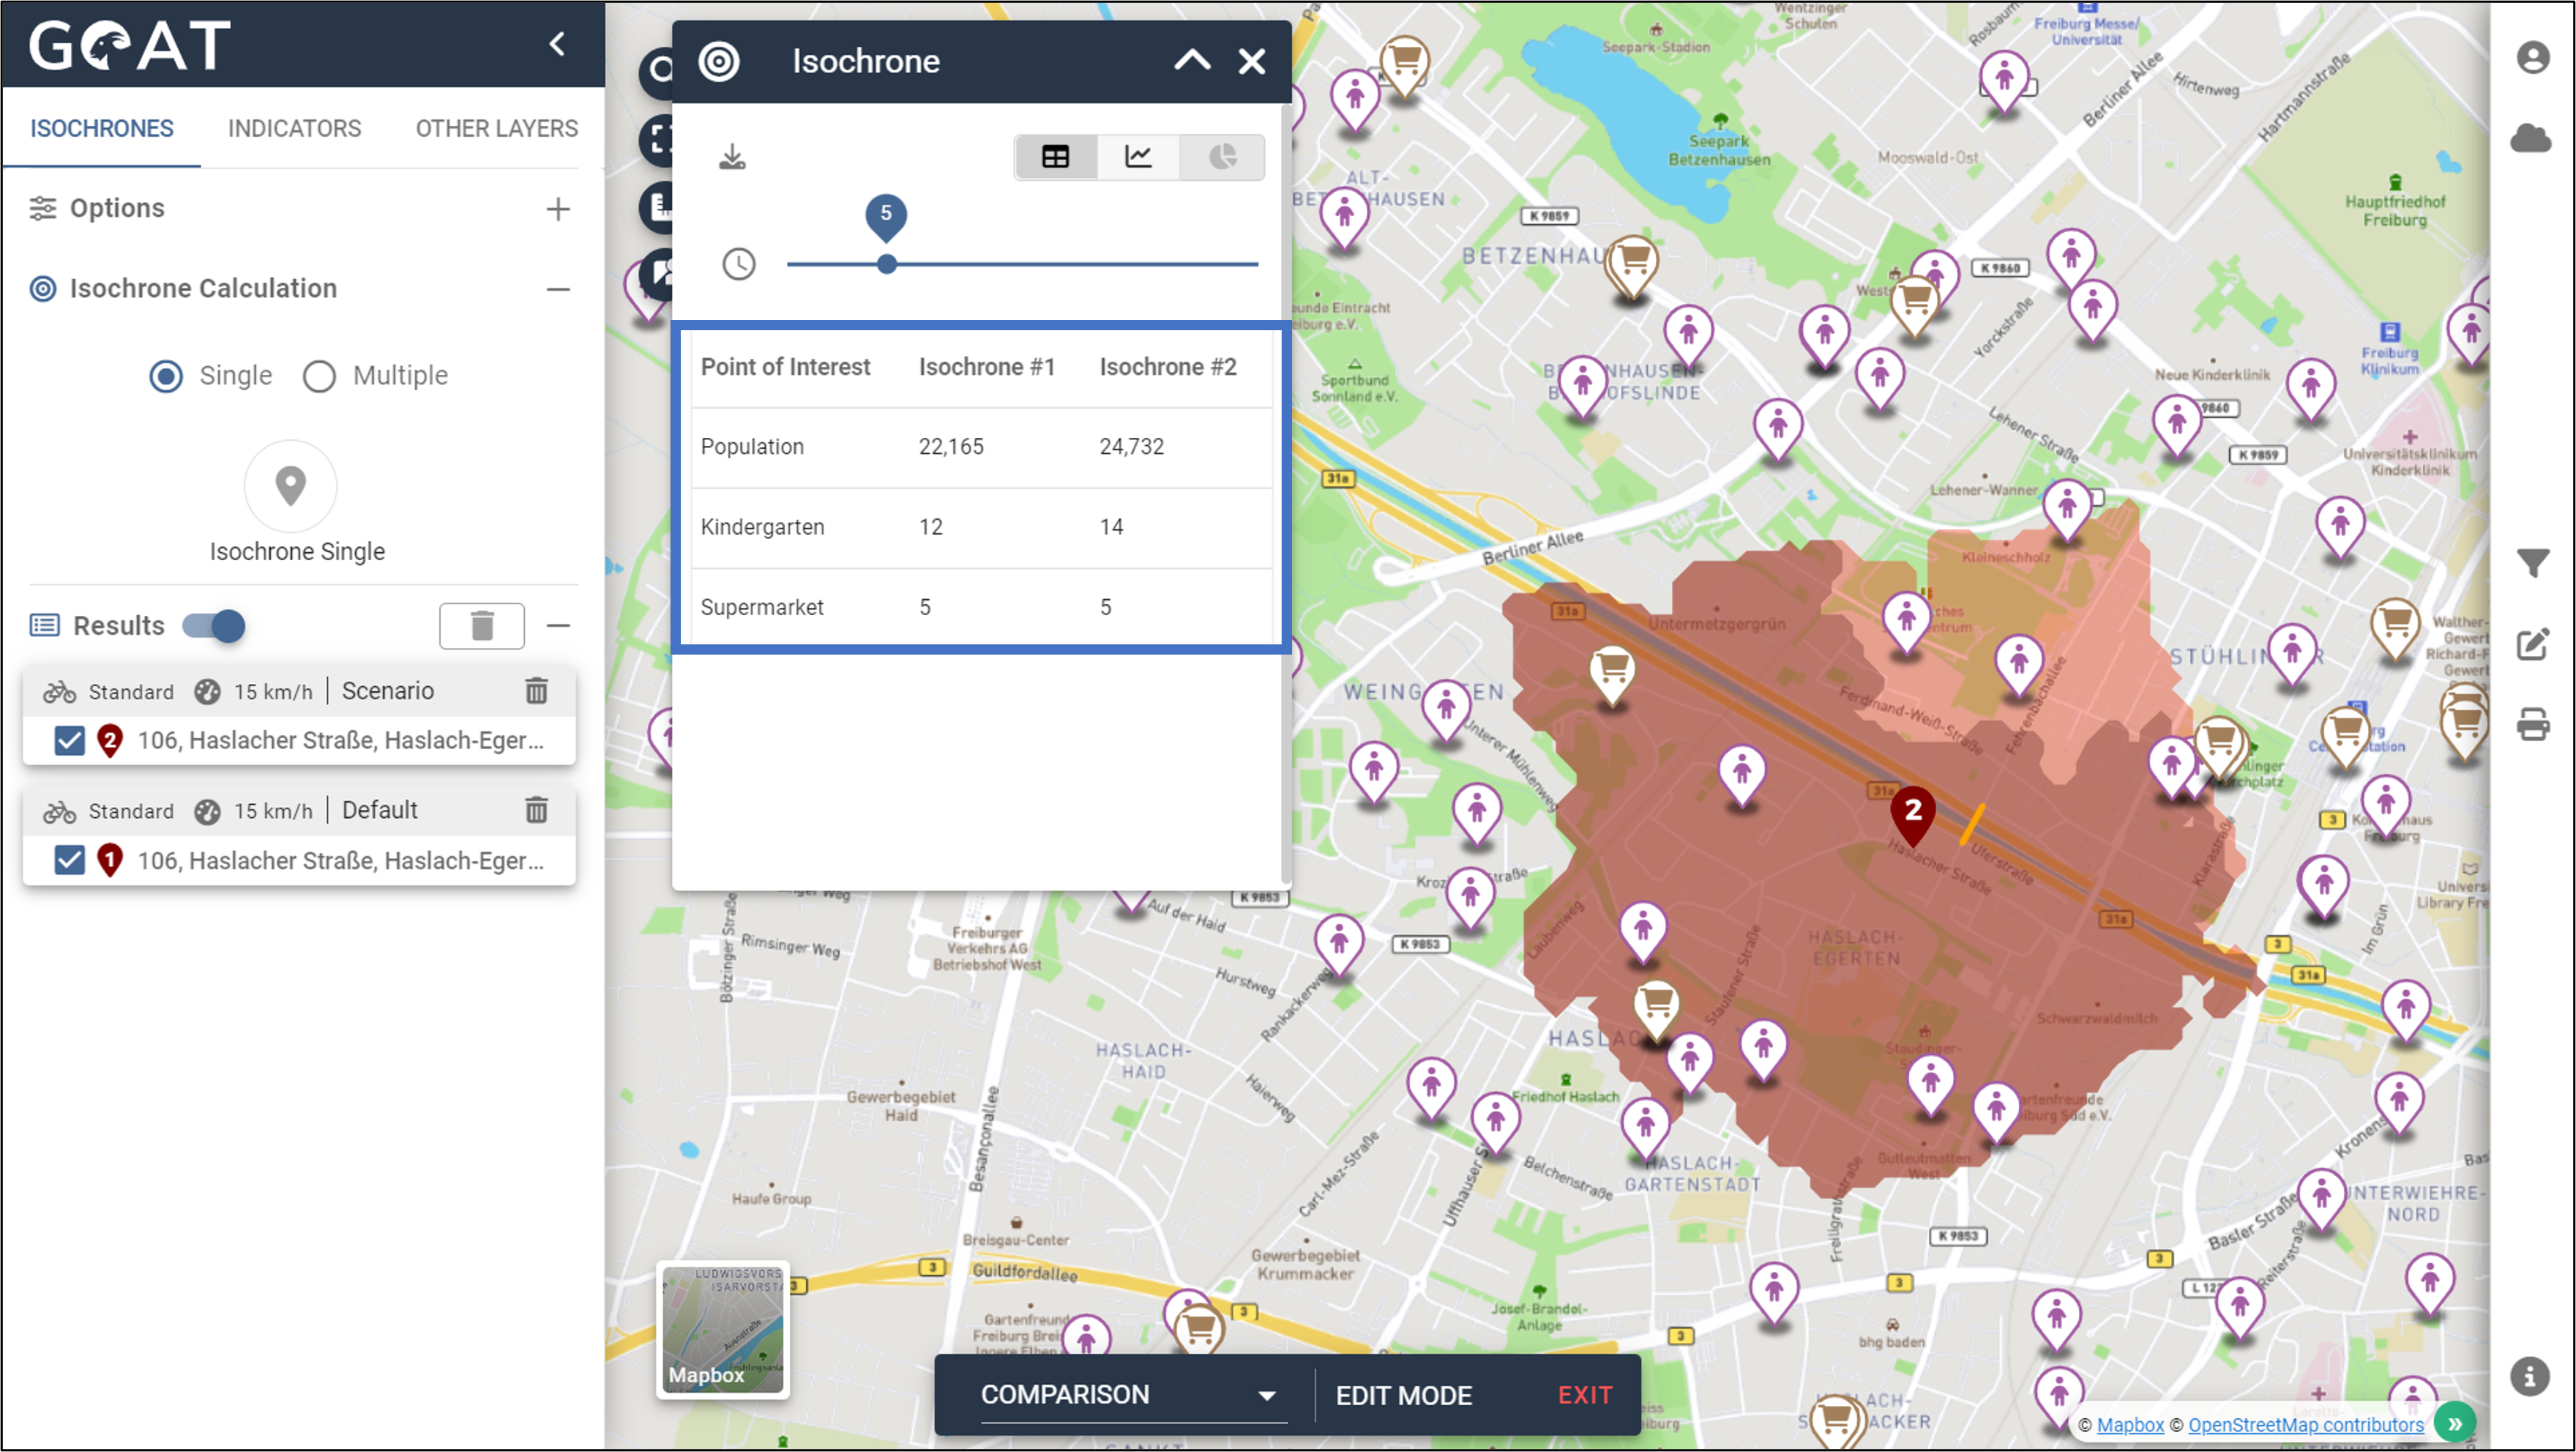
- Now you can analyze the effect of the new path connection on accessibility by calculating the isochrones for the current state and for the scenario. To do this, select the routing mode “Bike” and set the calculation mode to “Comparison.” In the options you can set the travel speed.
- Place the starting point for the isochrone calculation near the new bridge. As a result you will see one isochrone showing the actual state and one isochrone considering the new path connection. The result table shows the respective number of inhabitants within the isochrone.
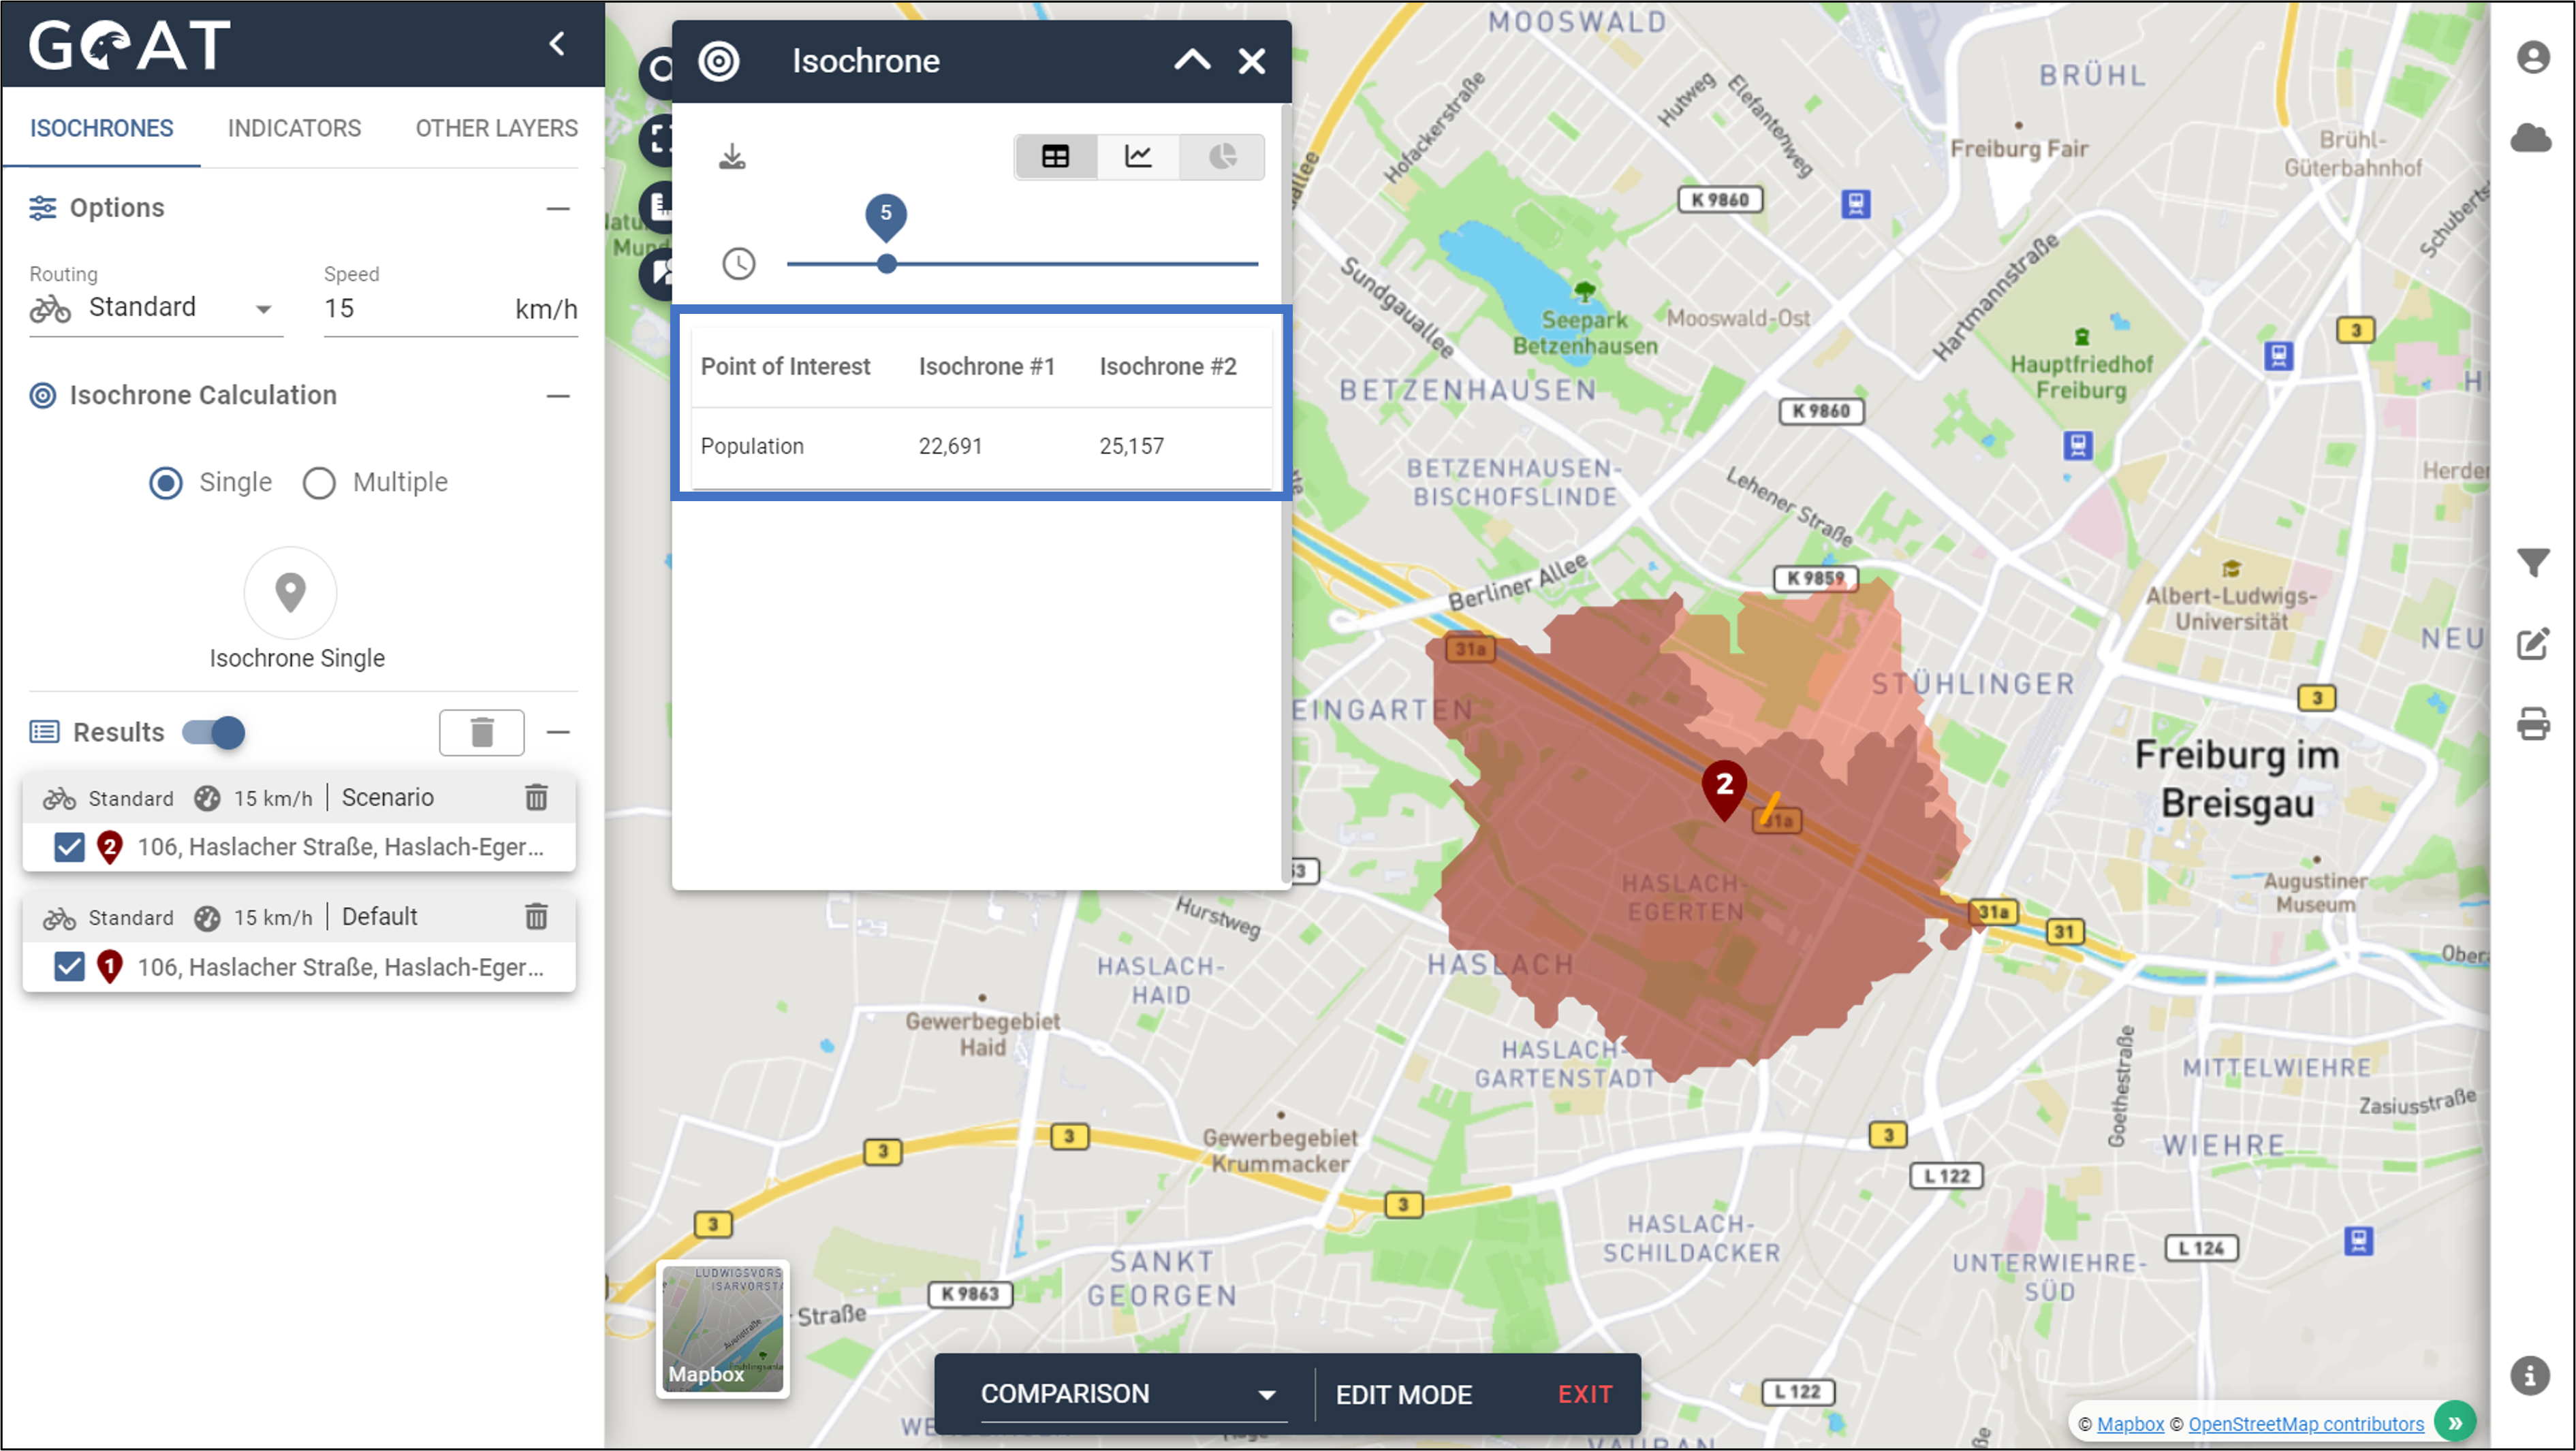
- By activating the poi data, it gets visual how many amenities are accessibility each in the current and the scenario state.