Videos for a quick start. Here the functions of GOAT are demonstrated exemplarily.
Quick overview of the functionalities
This video shows all GOAT functions in a quick run-through (2 min) and serves as an initial overview to familiarise yourself with the software.
Detailled overview of the functionalities
This video shows all GOAT functions in a detailled run-through (5 min) and serves as an initial overview to familiarise yourself with the software.
Calculate walking isochrones
Calculate walking isochrones at different places and compare their results. In addition, intersect the isochrones with population numbers and amenities.
Interactive network modifications
Perform your own scenarios by drawing, modifying or deleting links in the routing network within seconds and assess changes in accessibility.
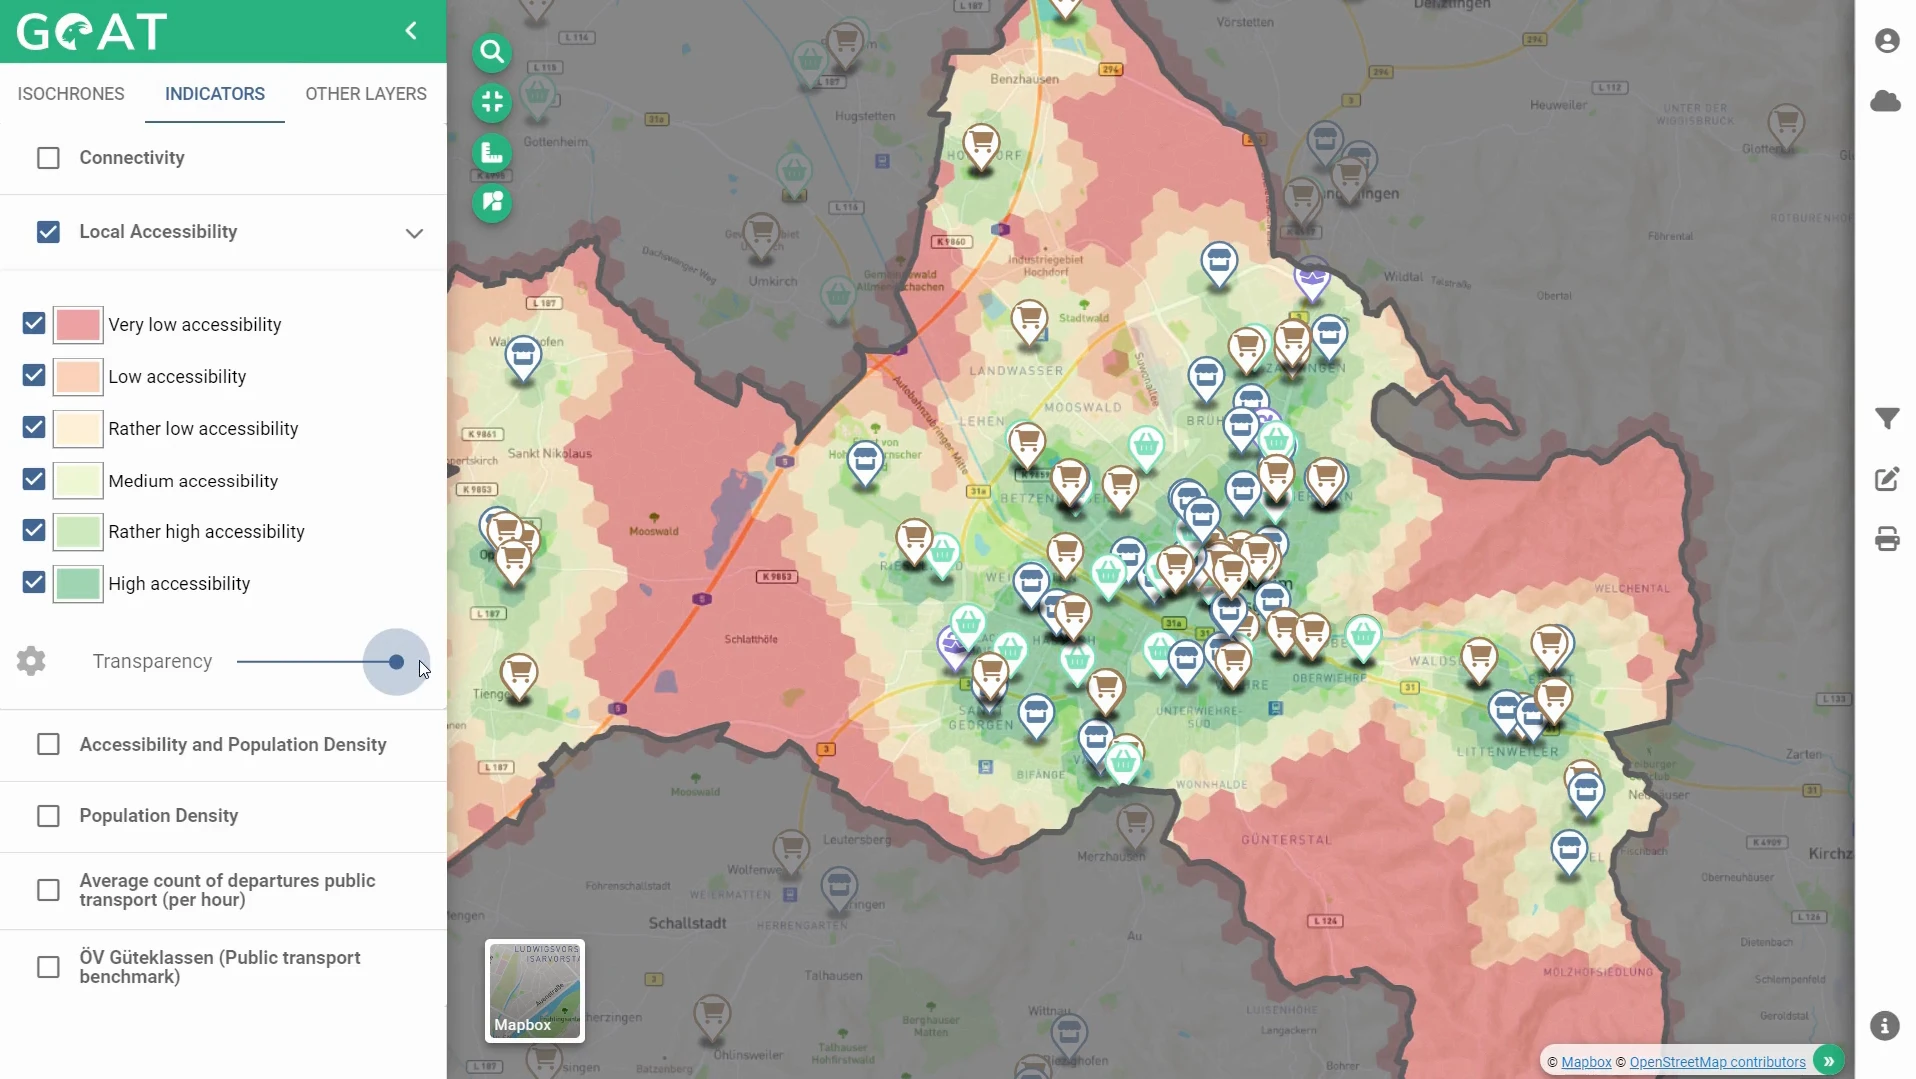
Compute and visualize walking accessibility
The dynamic heatmap makes use of gravity-based accessibility measures and allows you to show accessiblity levels for many amenities on a grid level.
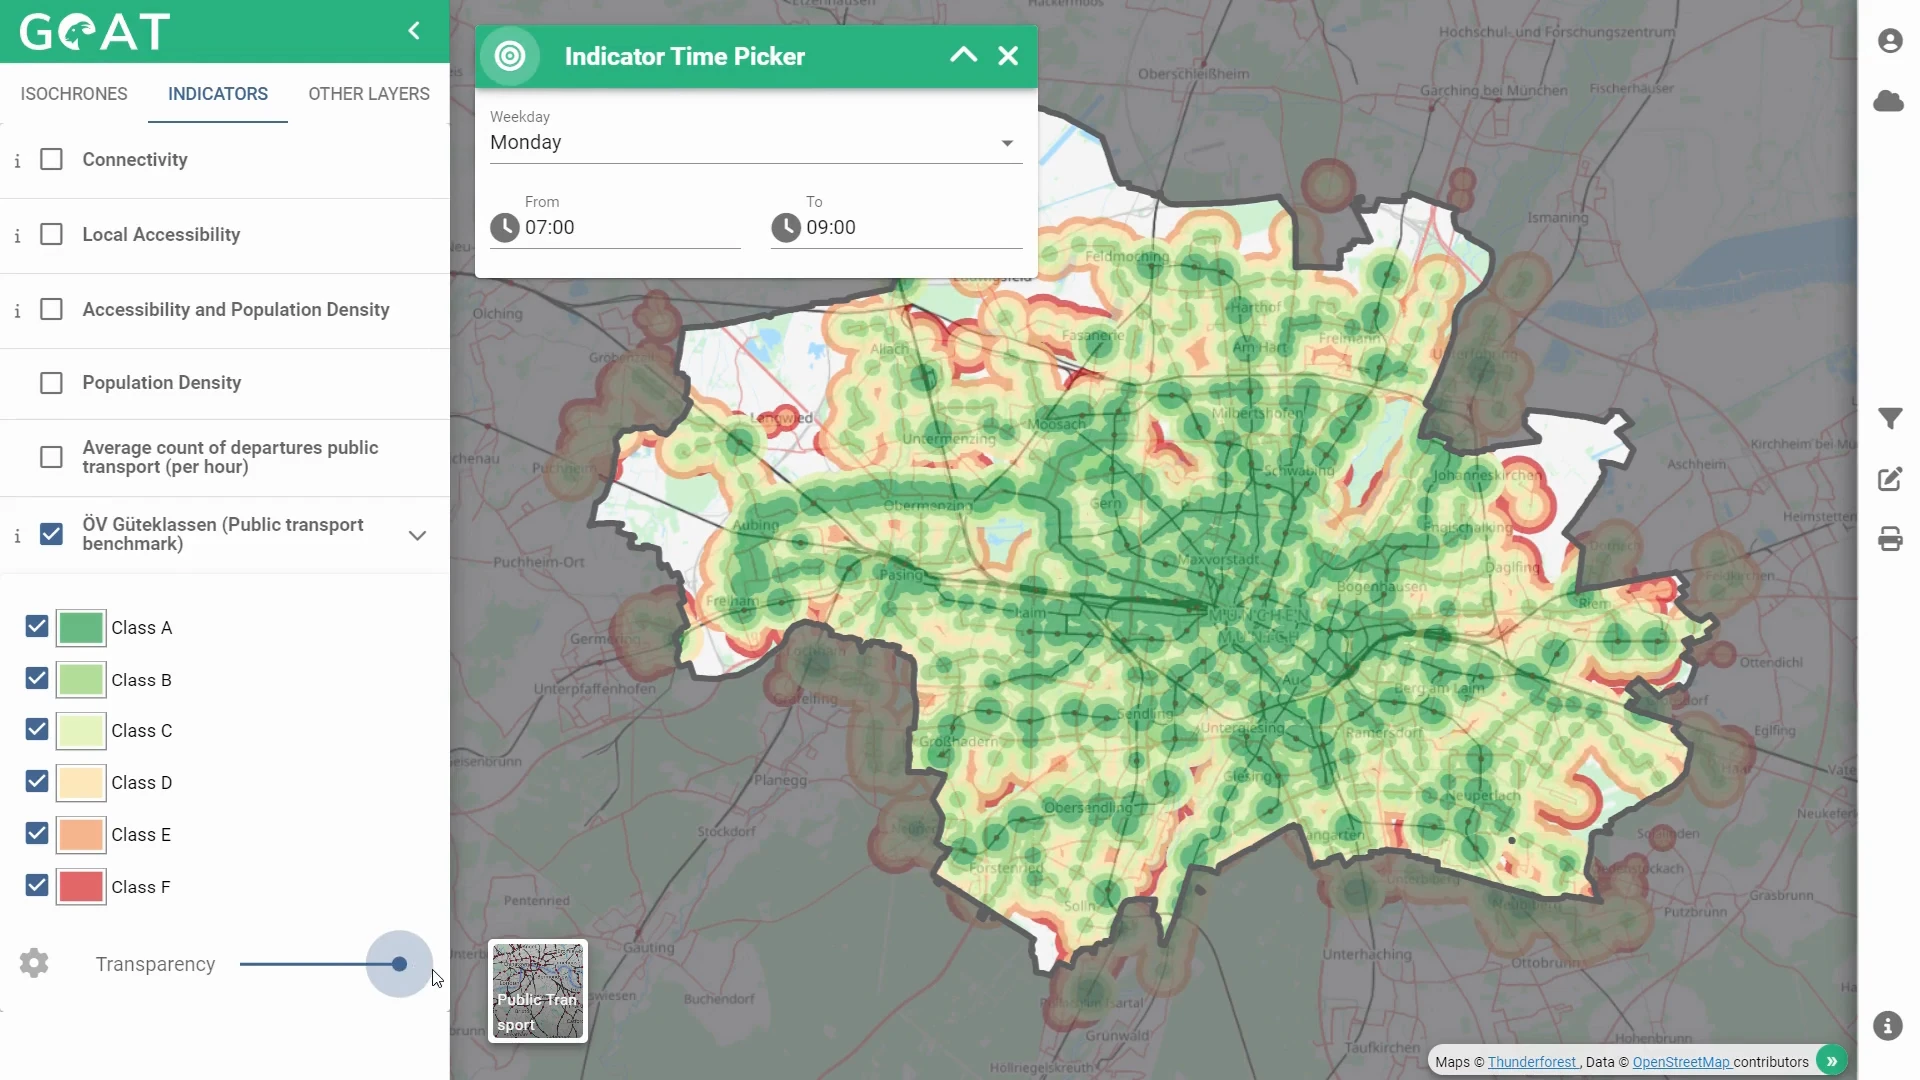
Analyze the public transport quality
Analyze the public transport benchmarks, visualize service frequencies and calculate public transport isochrones.
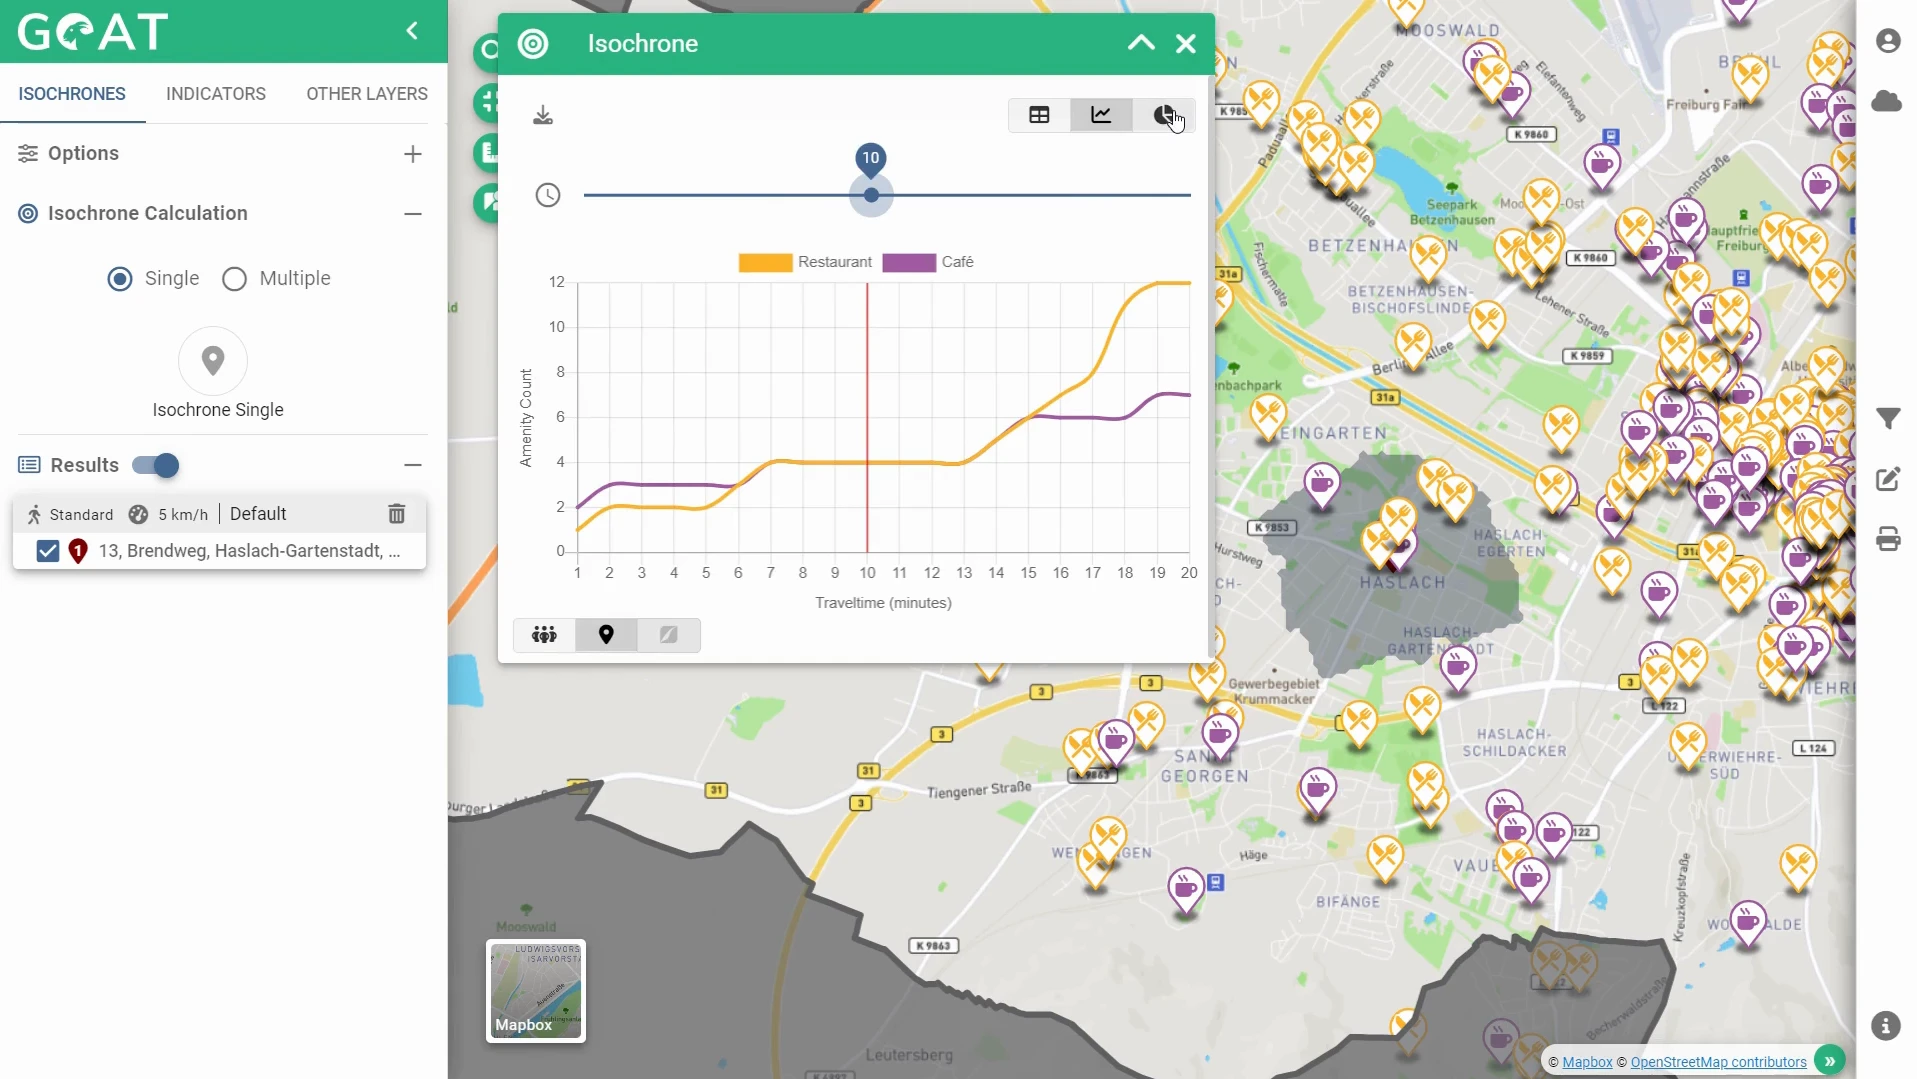
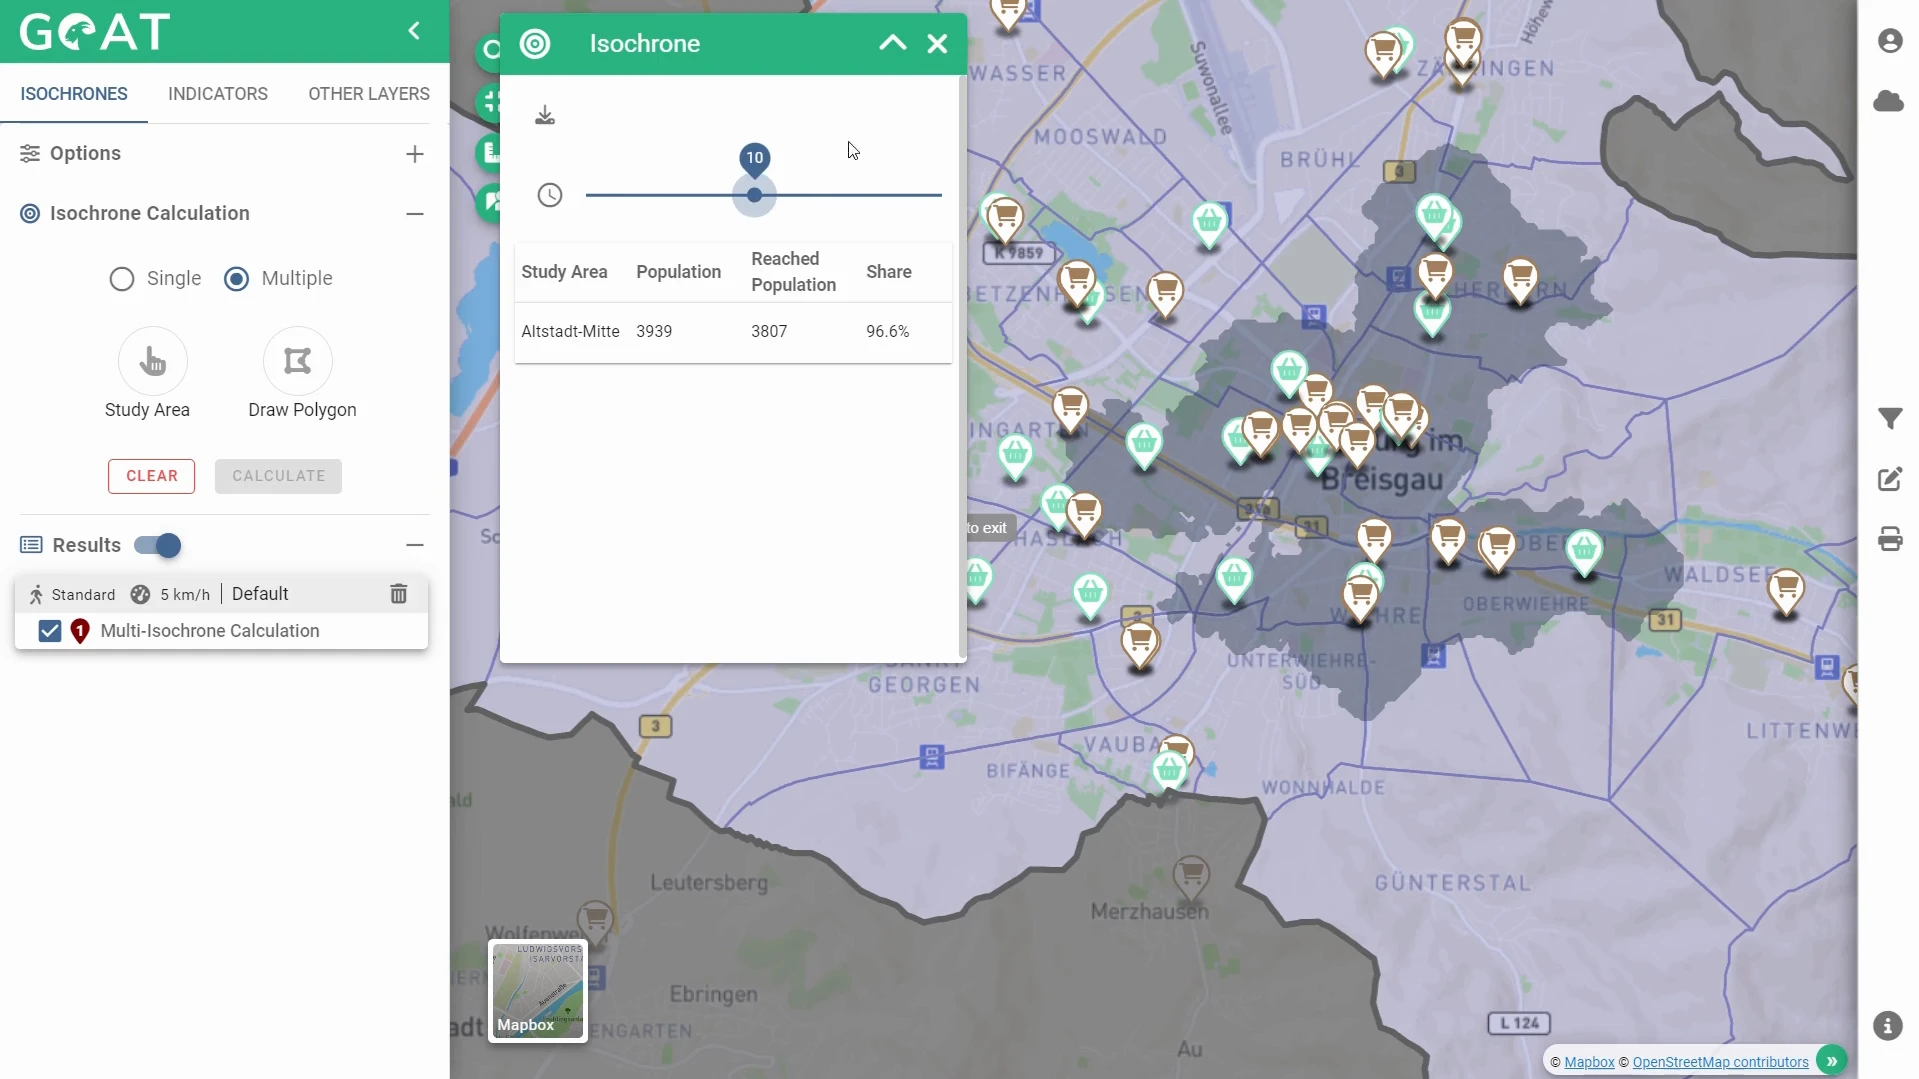
Interactively compute multi-isochrones
Show in seconds how many residents from a certain neighborhood have access to an amenity in a traveltime of your choice by using multi-isochrones.
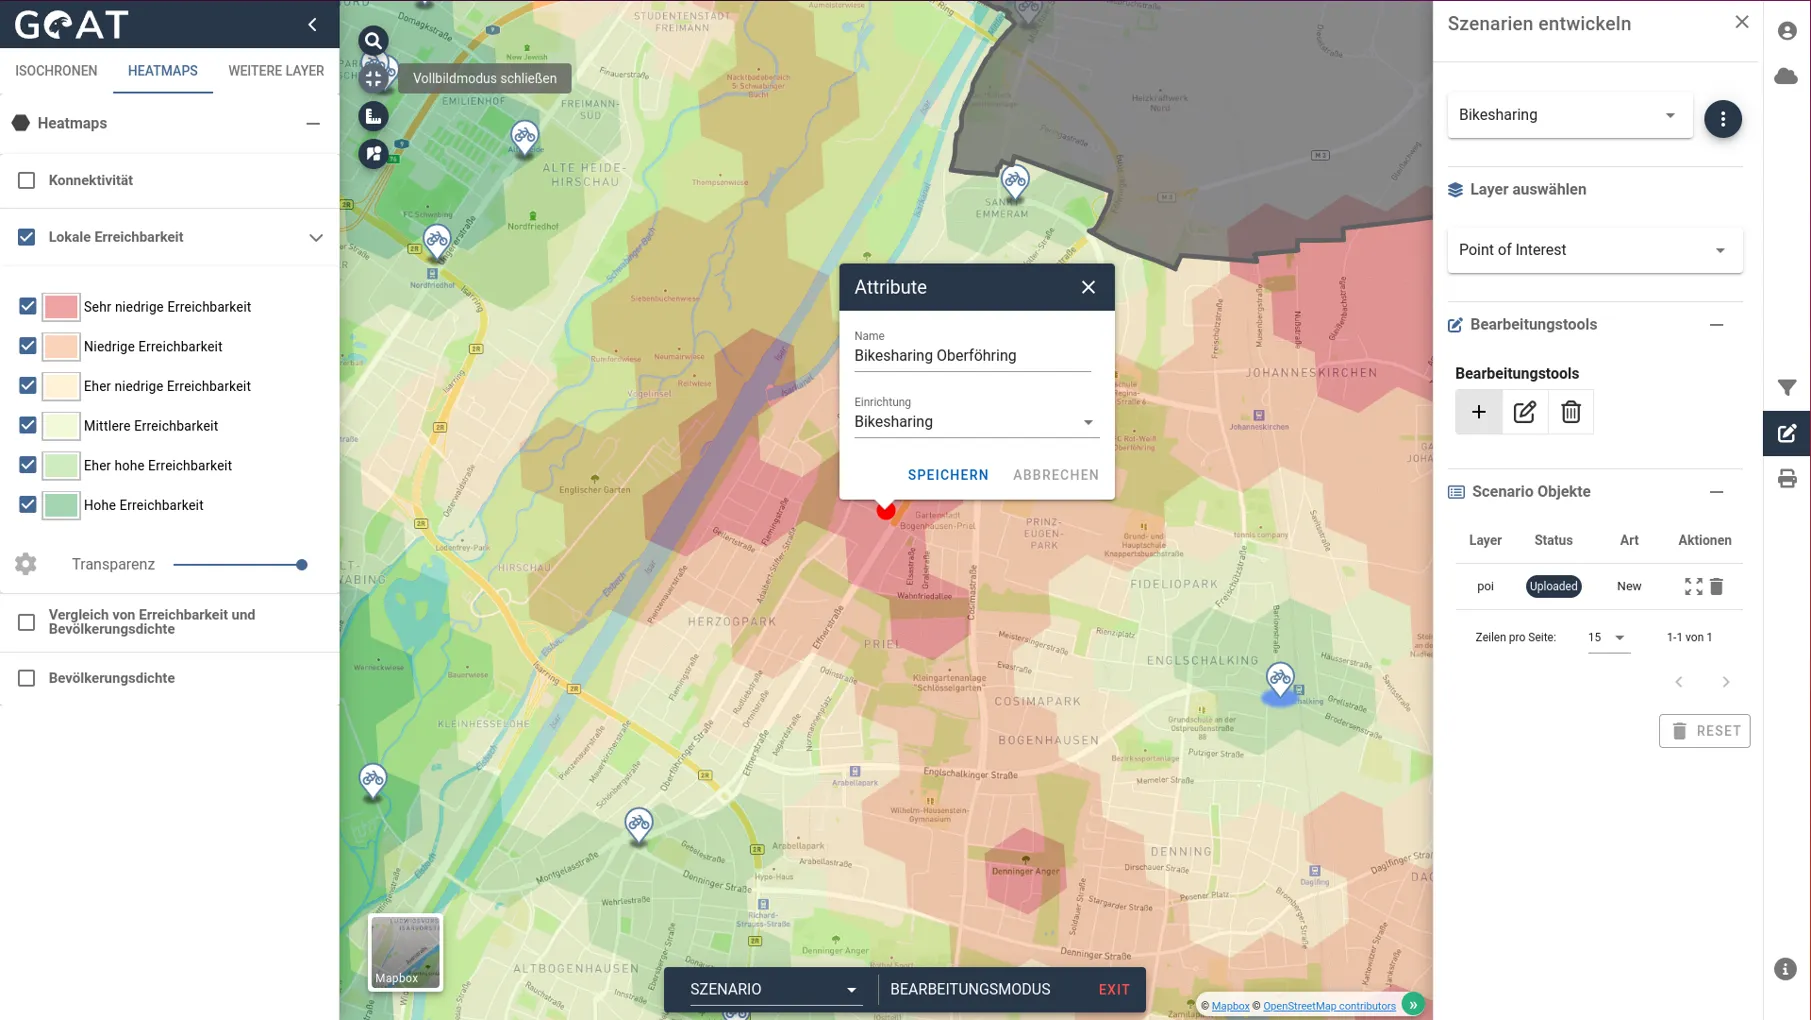
Use GOAT for location planning
Add, modify and delete points of interest and assess the effects on accessibility on the fly within a few seconds.
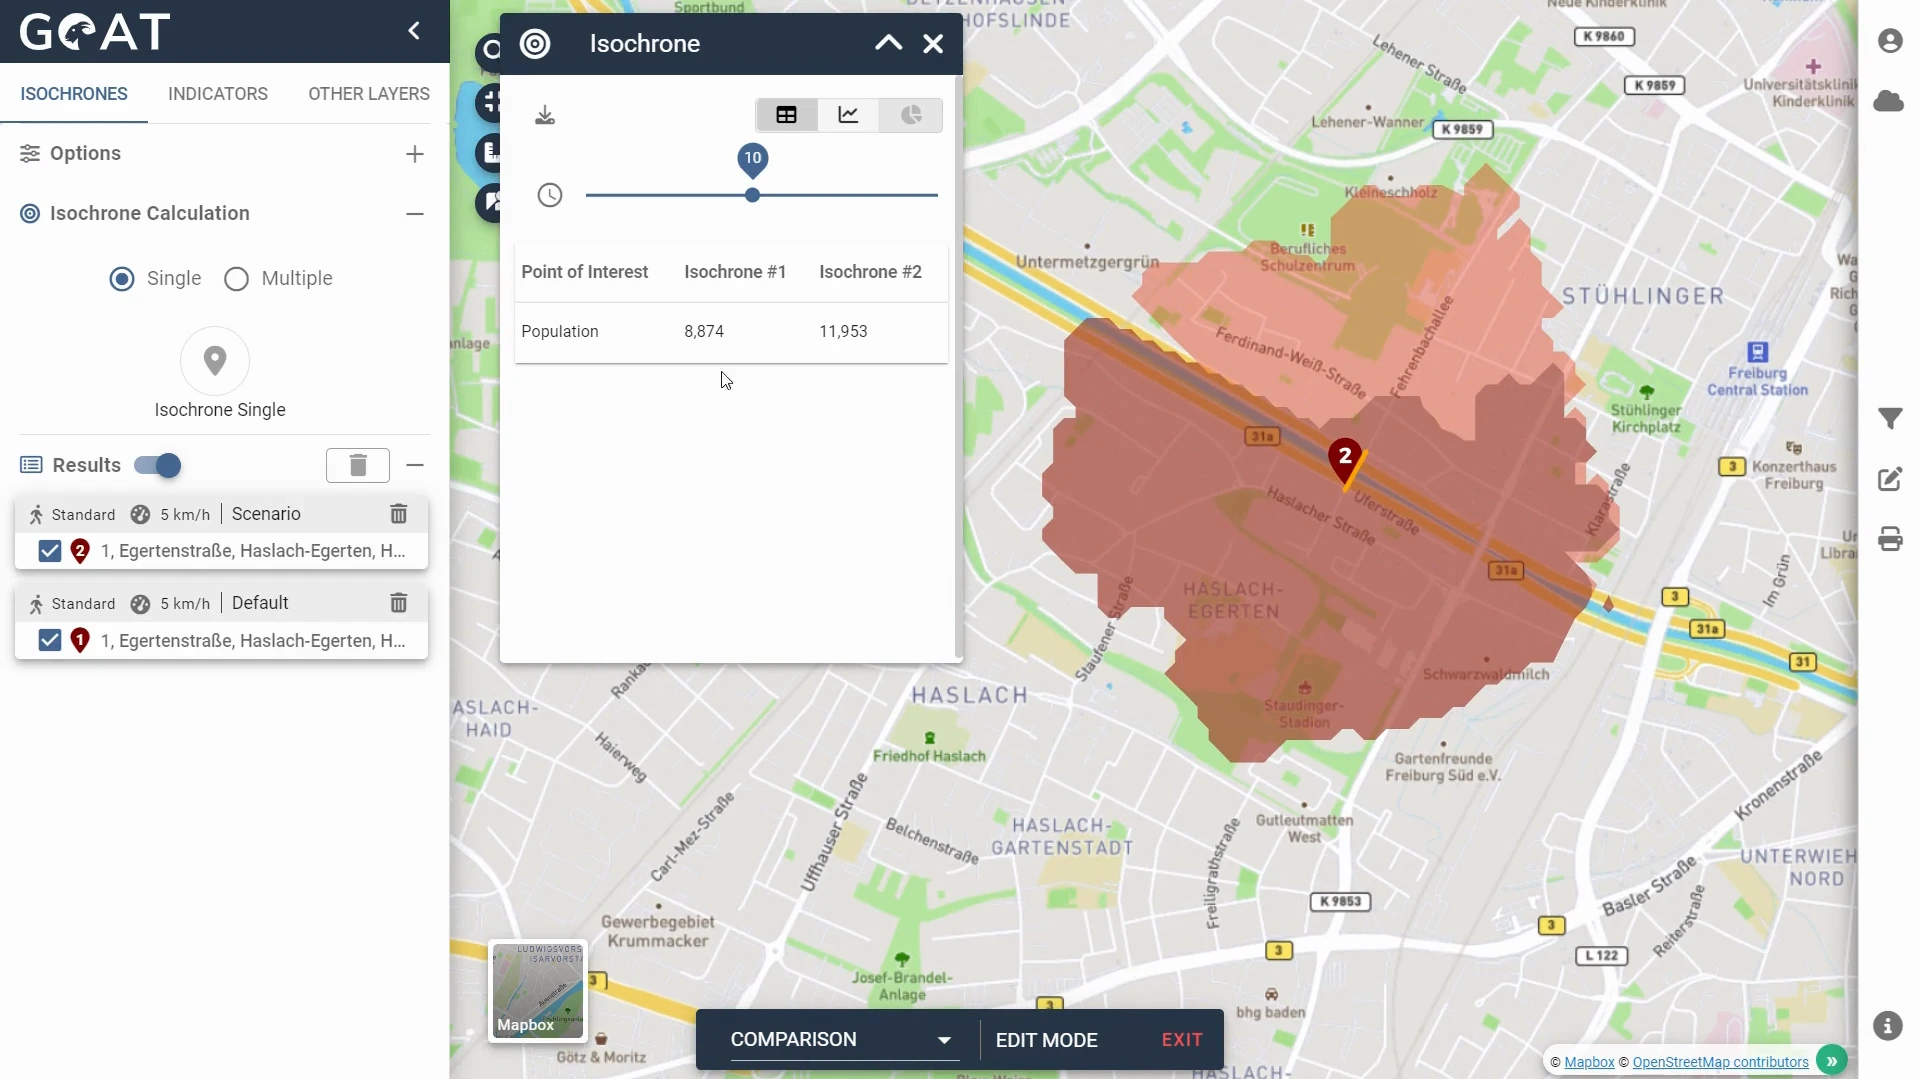
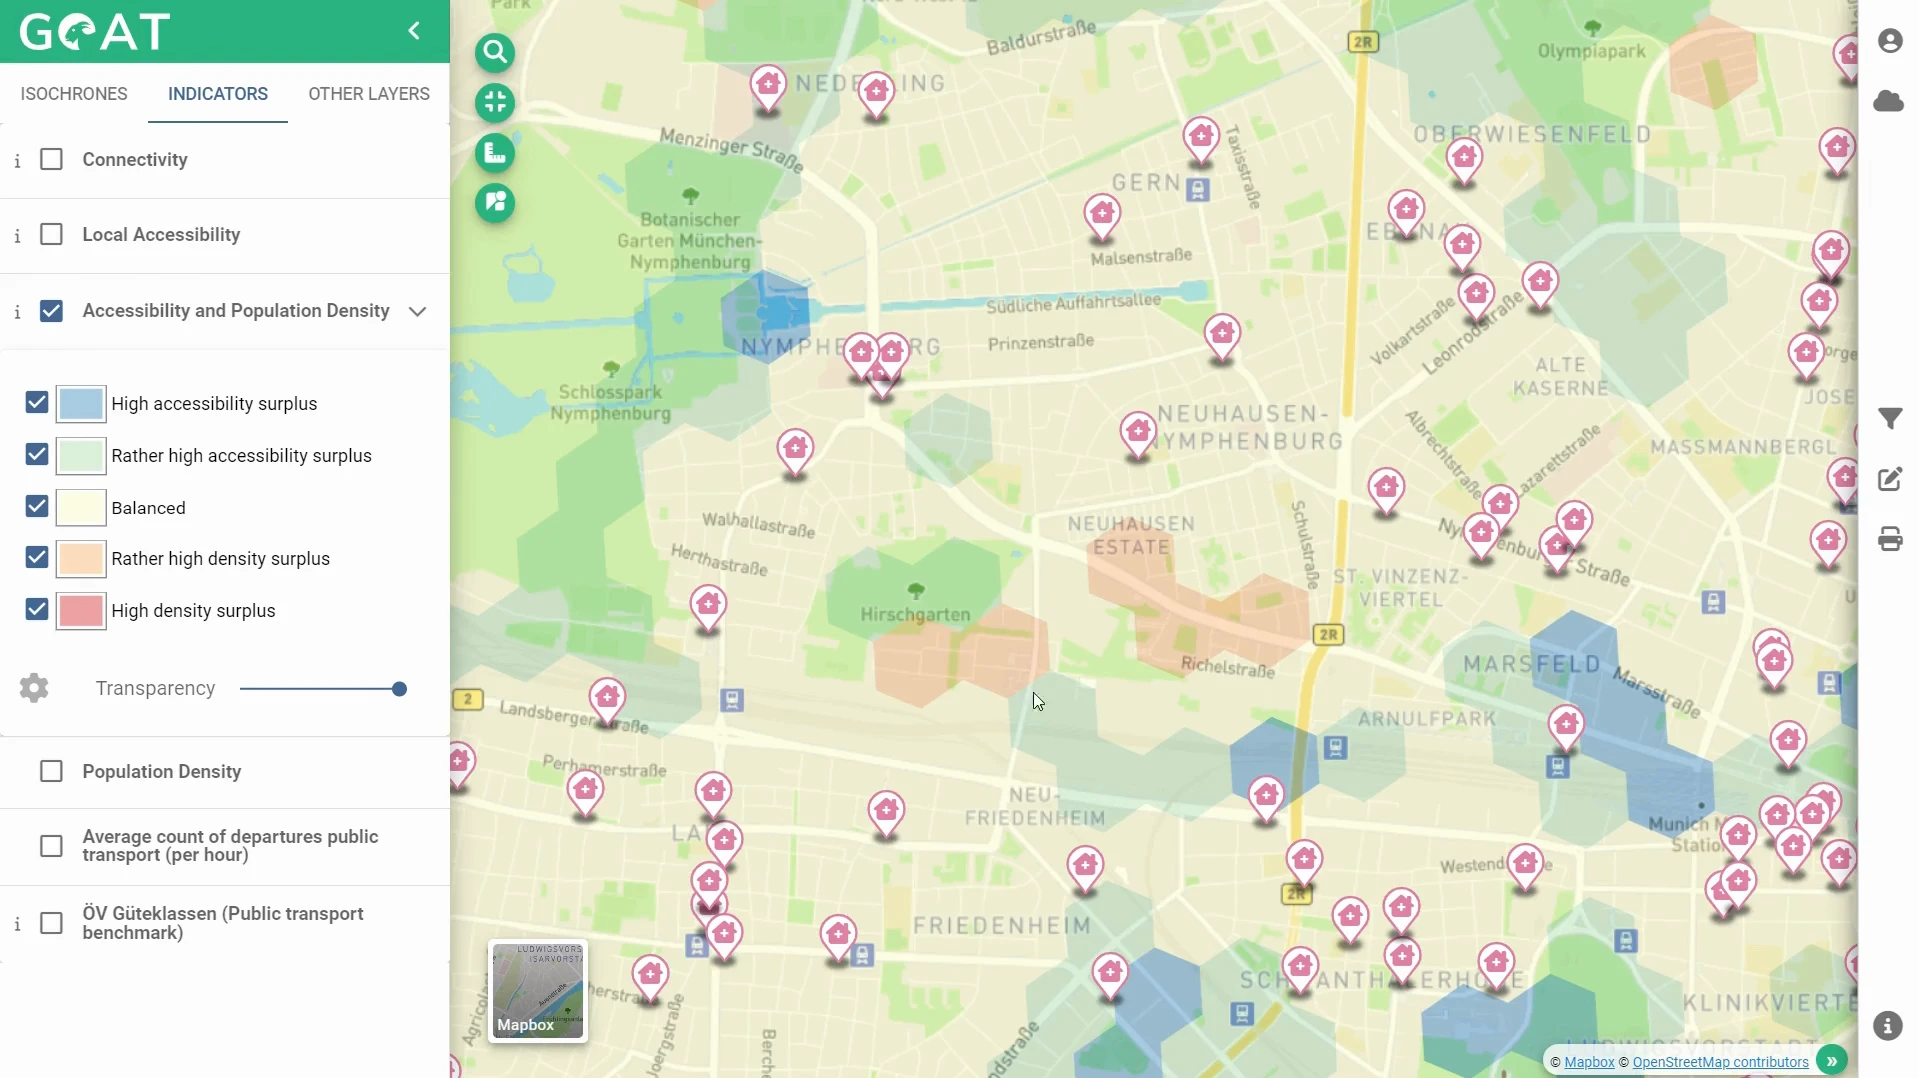
Comparison population density and accessibility
Compare accessibility levels and populations density in order to assess the spatial distribution of e.g. bicycle-sharing stations.
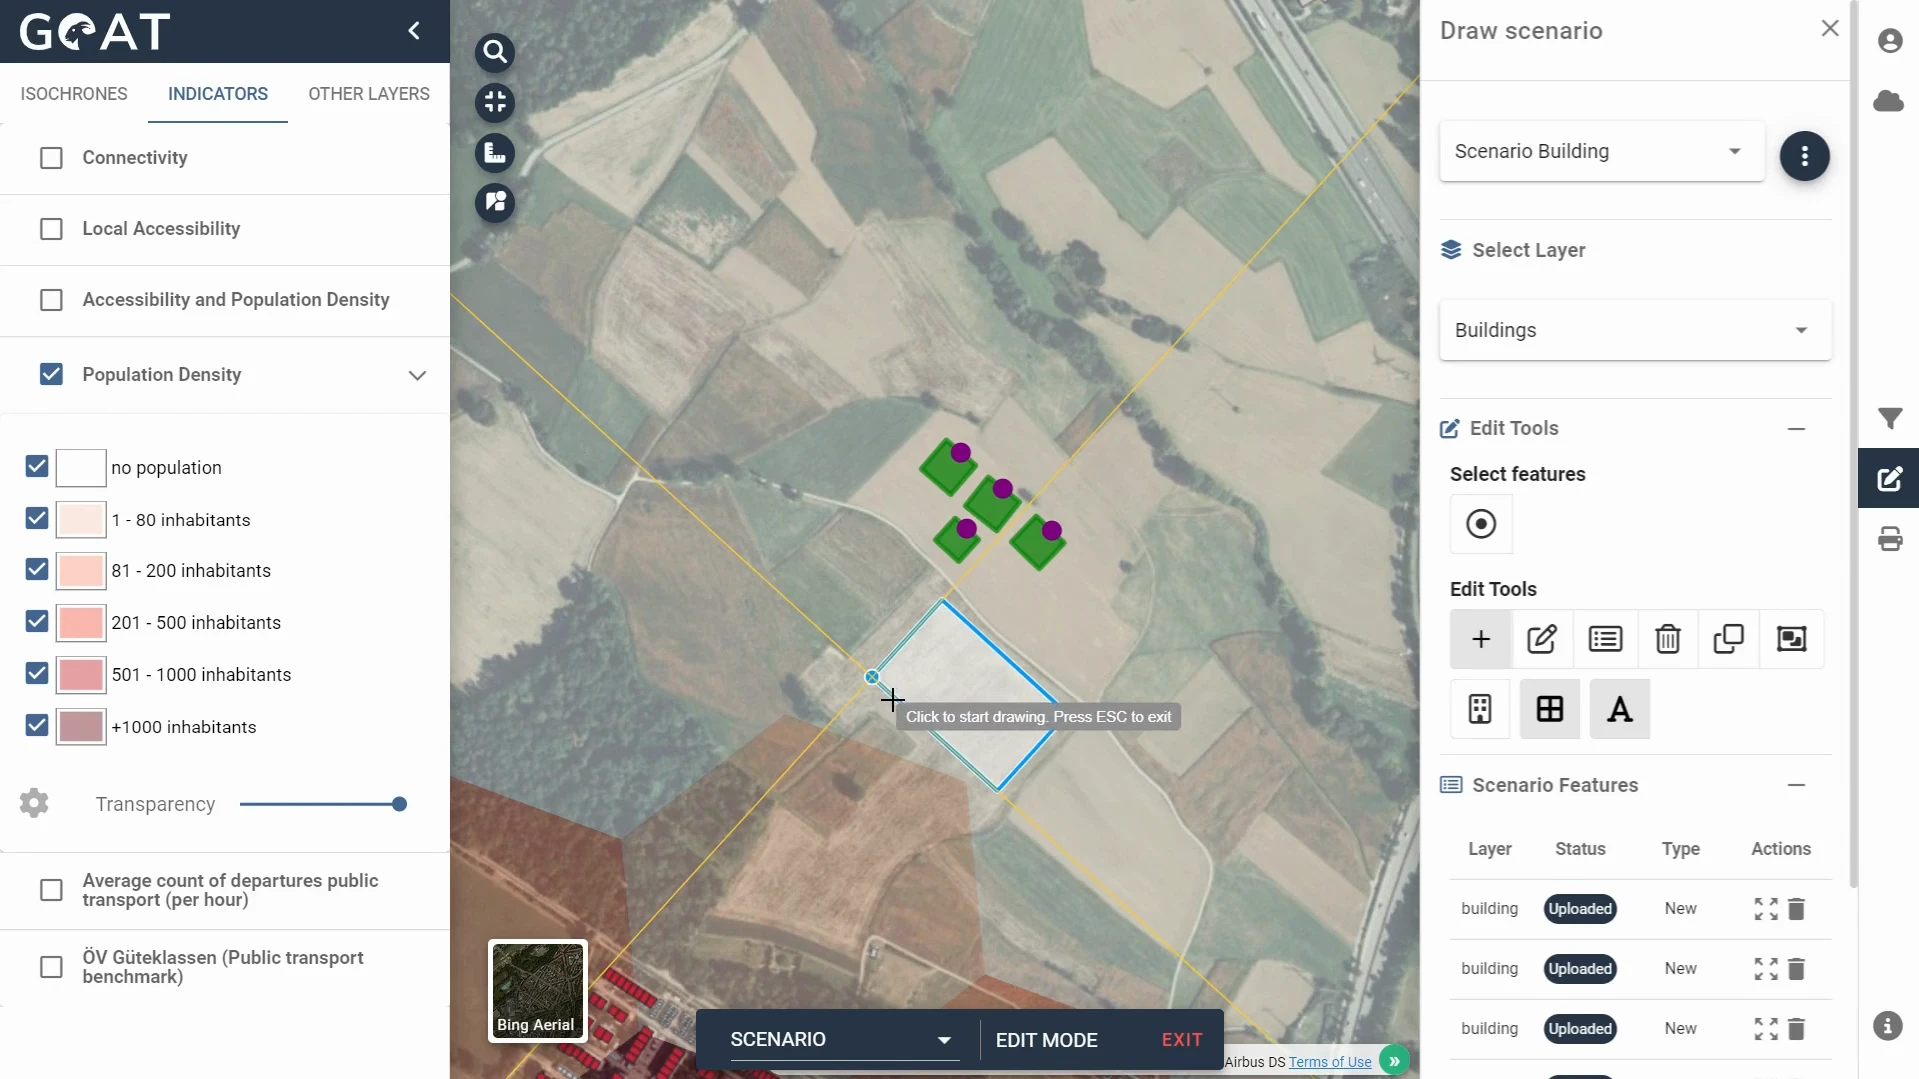
Plan new residential areas
You can draw new buildings, allocate new population and assess how good they are served with daily needs.
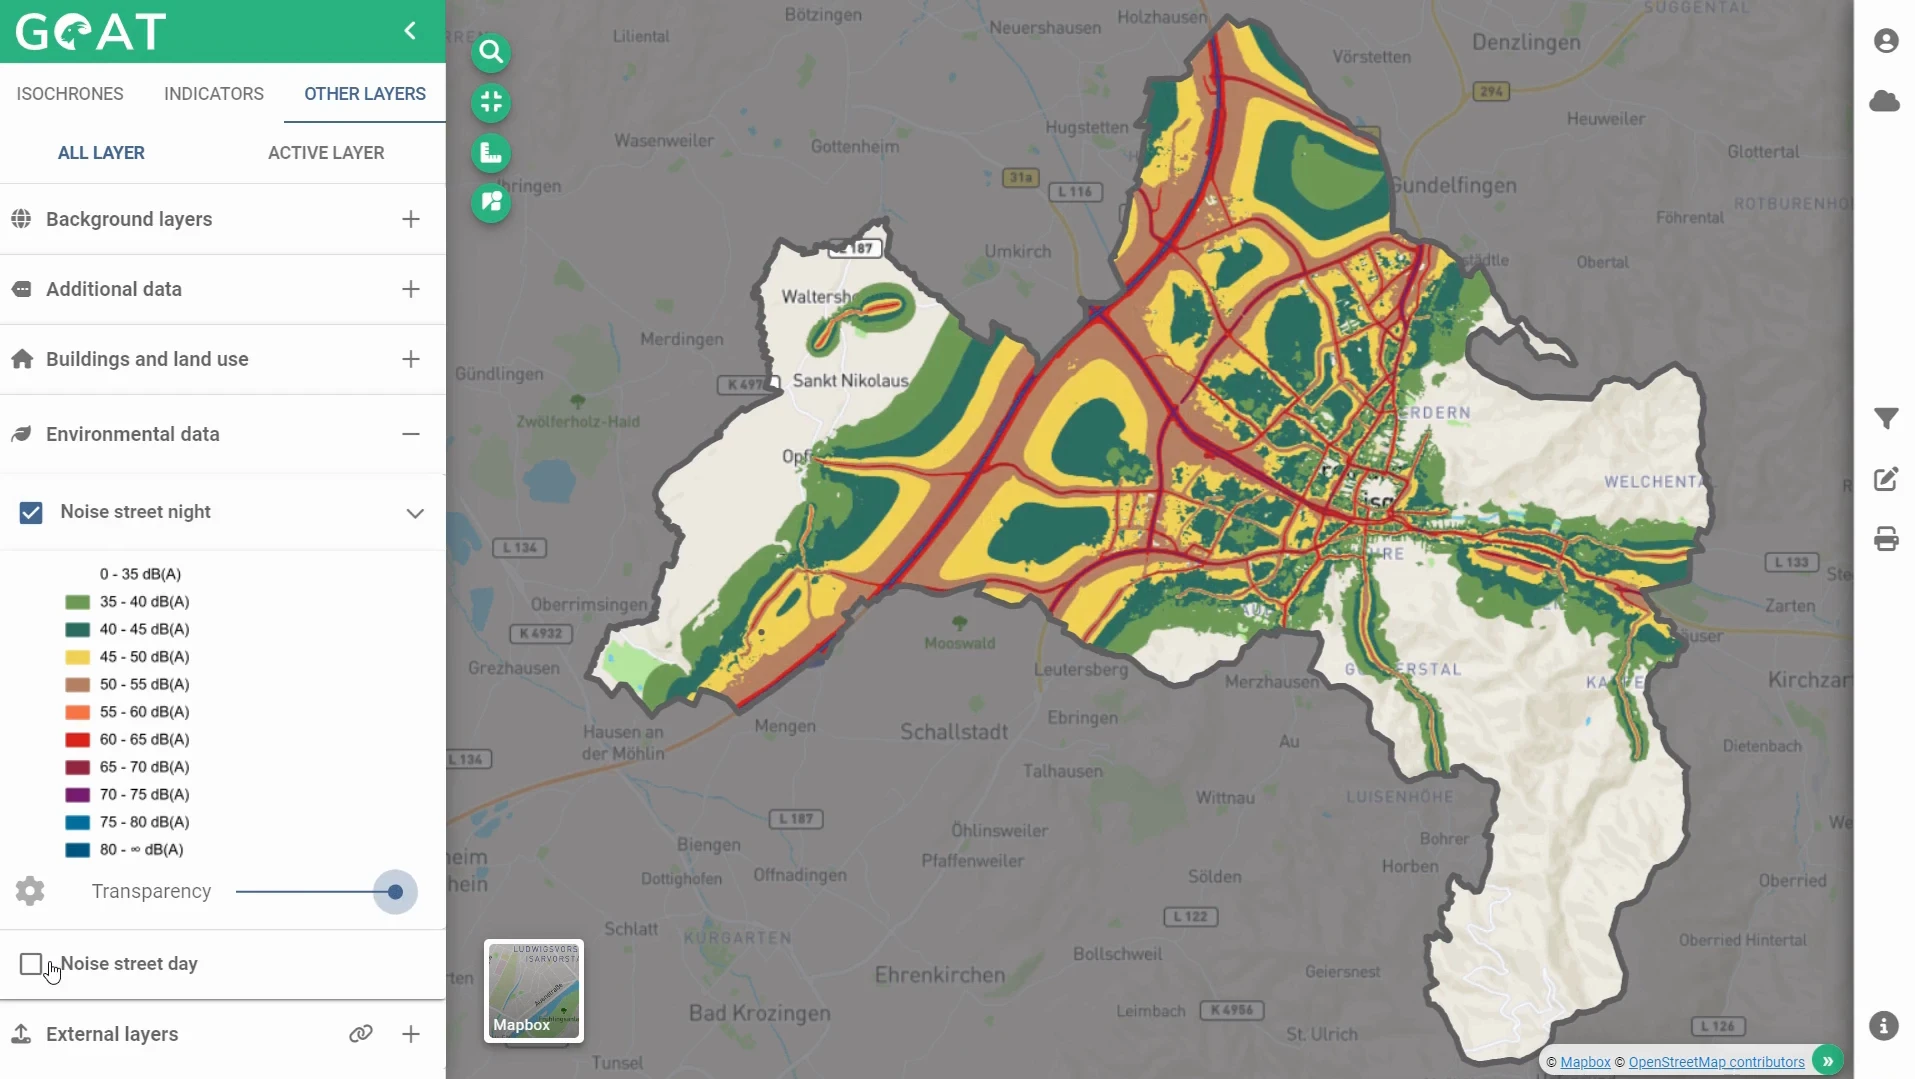
Visualize extensive spatial data
Easily visualise extensive spatial data. Depending on local availability e.g. noise levels, land use or accident numbers can be integrated.
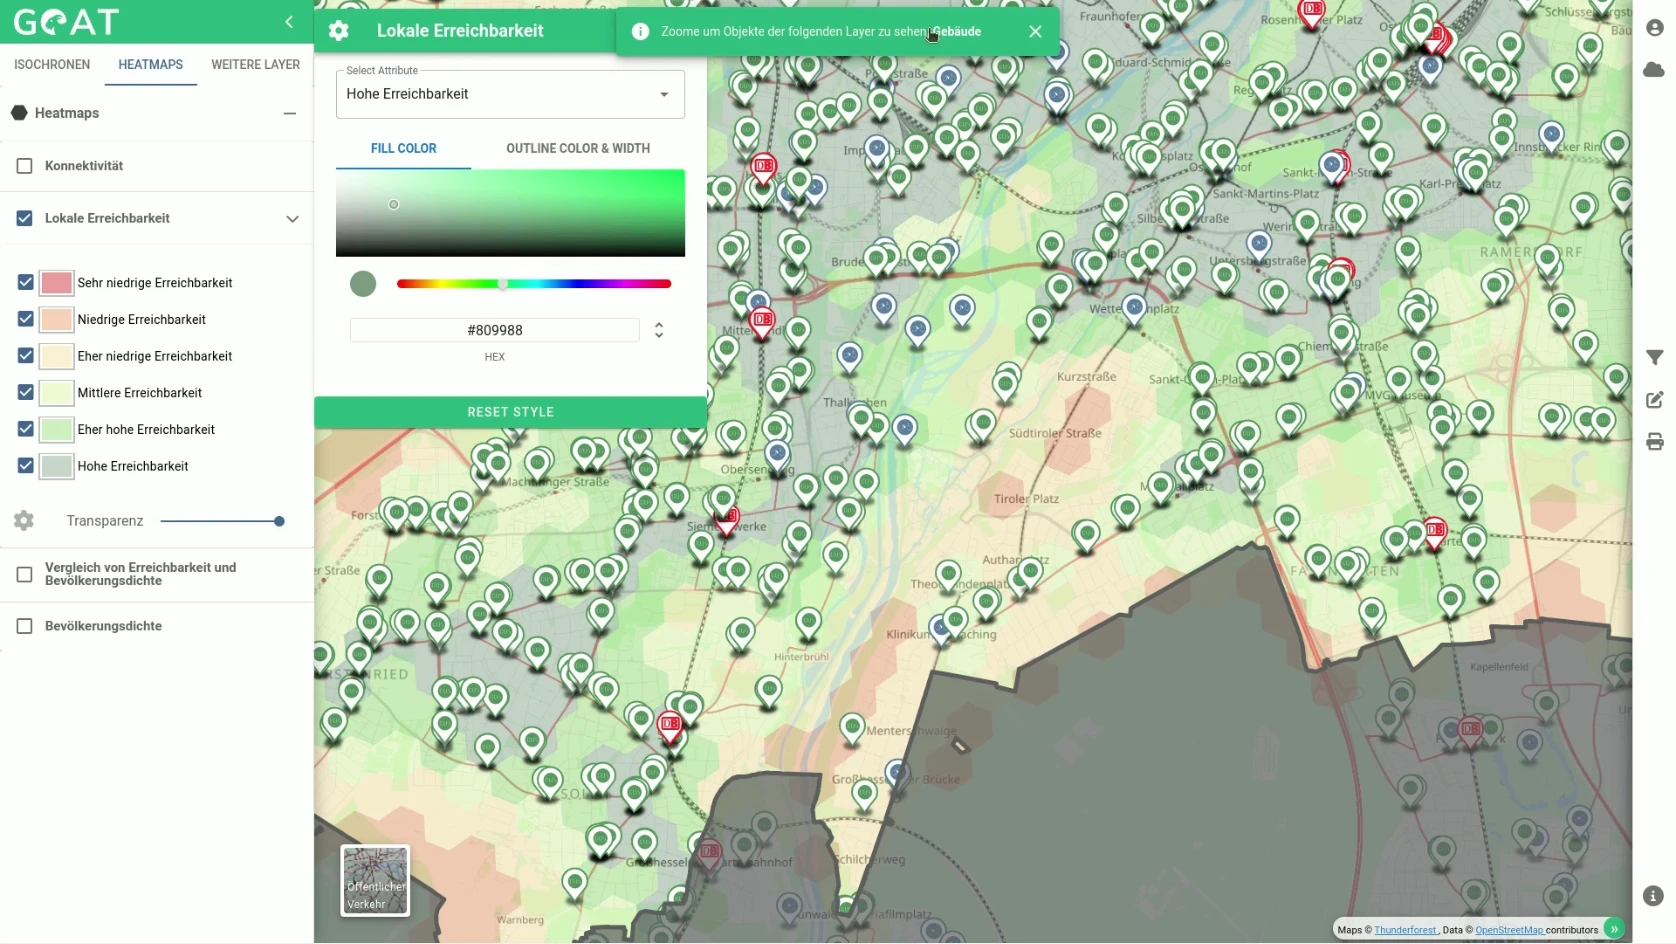
Create individualized maps
In GOAT, the colours of all layers and elements can be customised to create and print personalised maps.