
Analyze, Map, and Publish in one WebGIS
Bring your spatial data together, run accessibility and GIS analysis, and build automated workflows. Turn everything into interactive maps and print layouts or reports.

Trusted by municipalities, transport authorities and planning offices












Open-source and cloud-based
The WebGIS GOAT
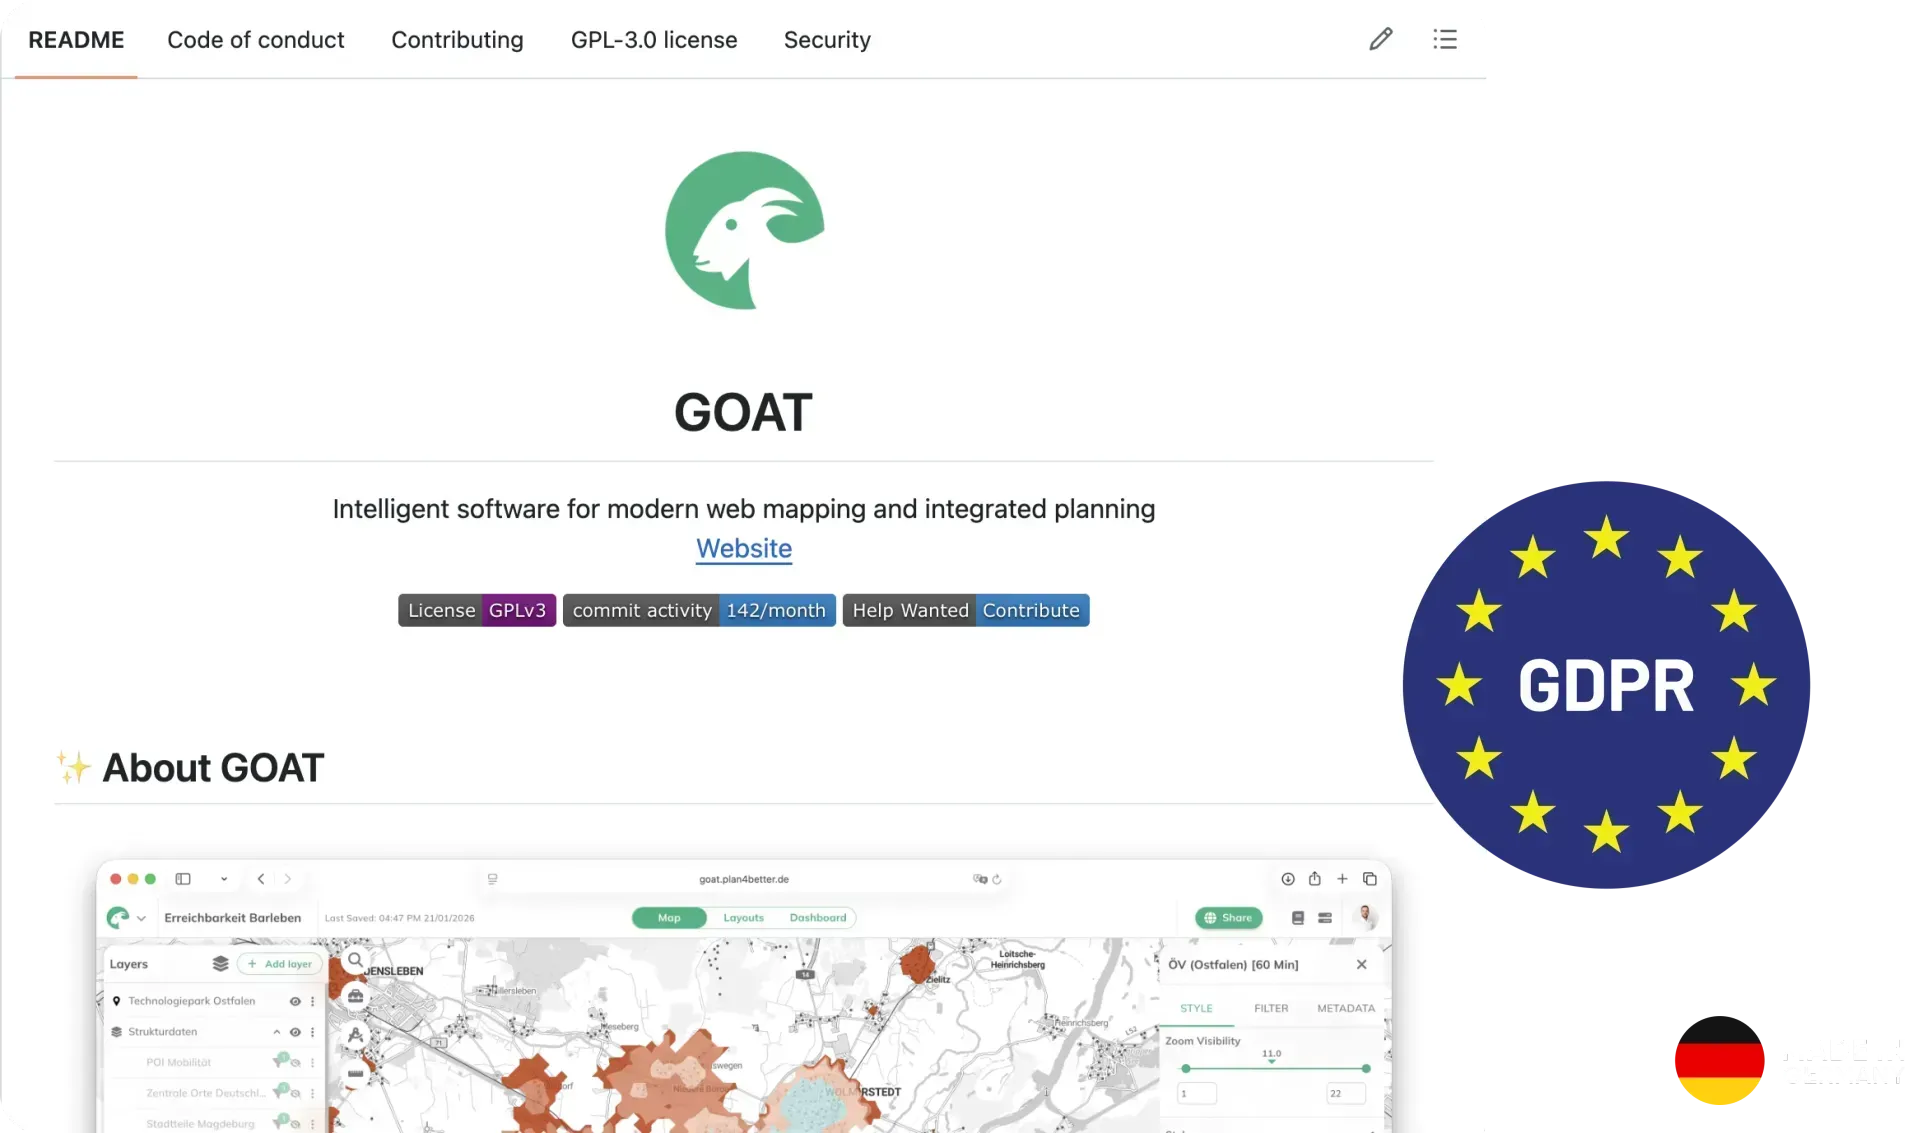
One platform for the whole spatial workflow: bring your data together, run accessibility and GIS analysis, build dashboards and print-ready maps, automate the repetitive parts and collaborate in real time.
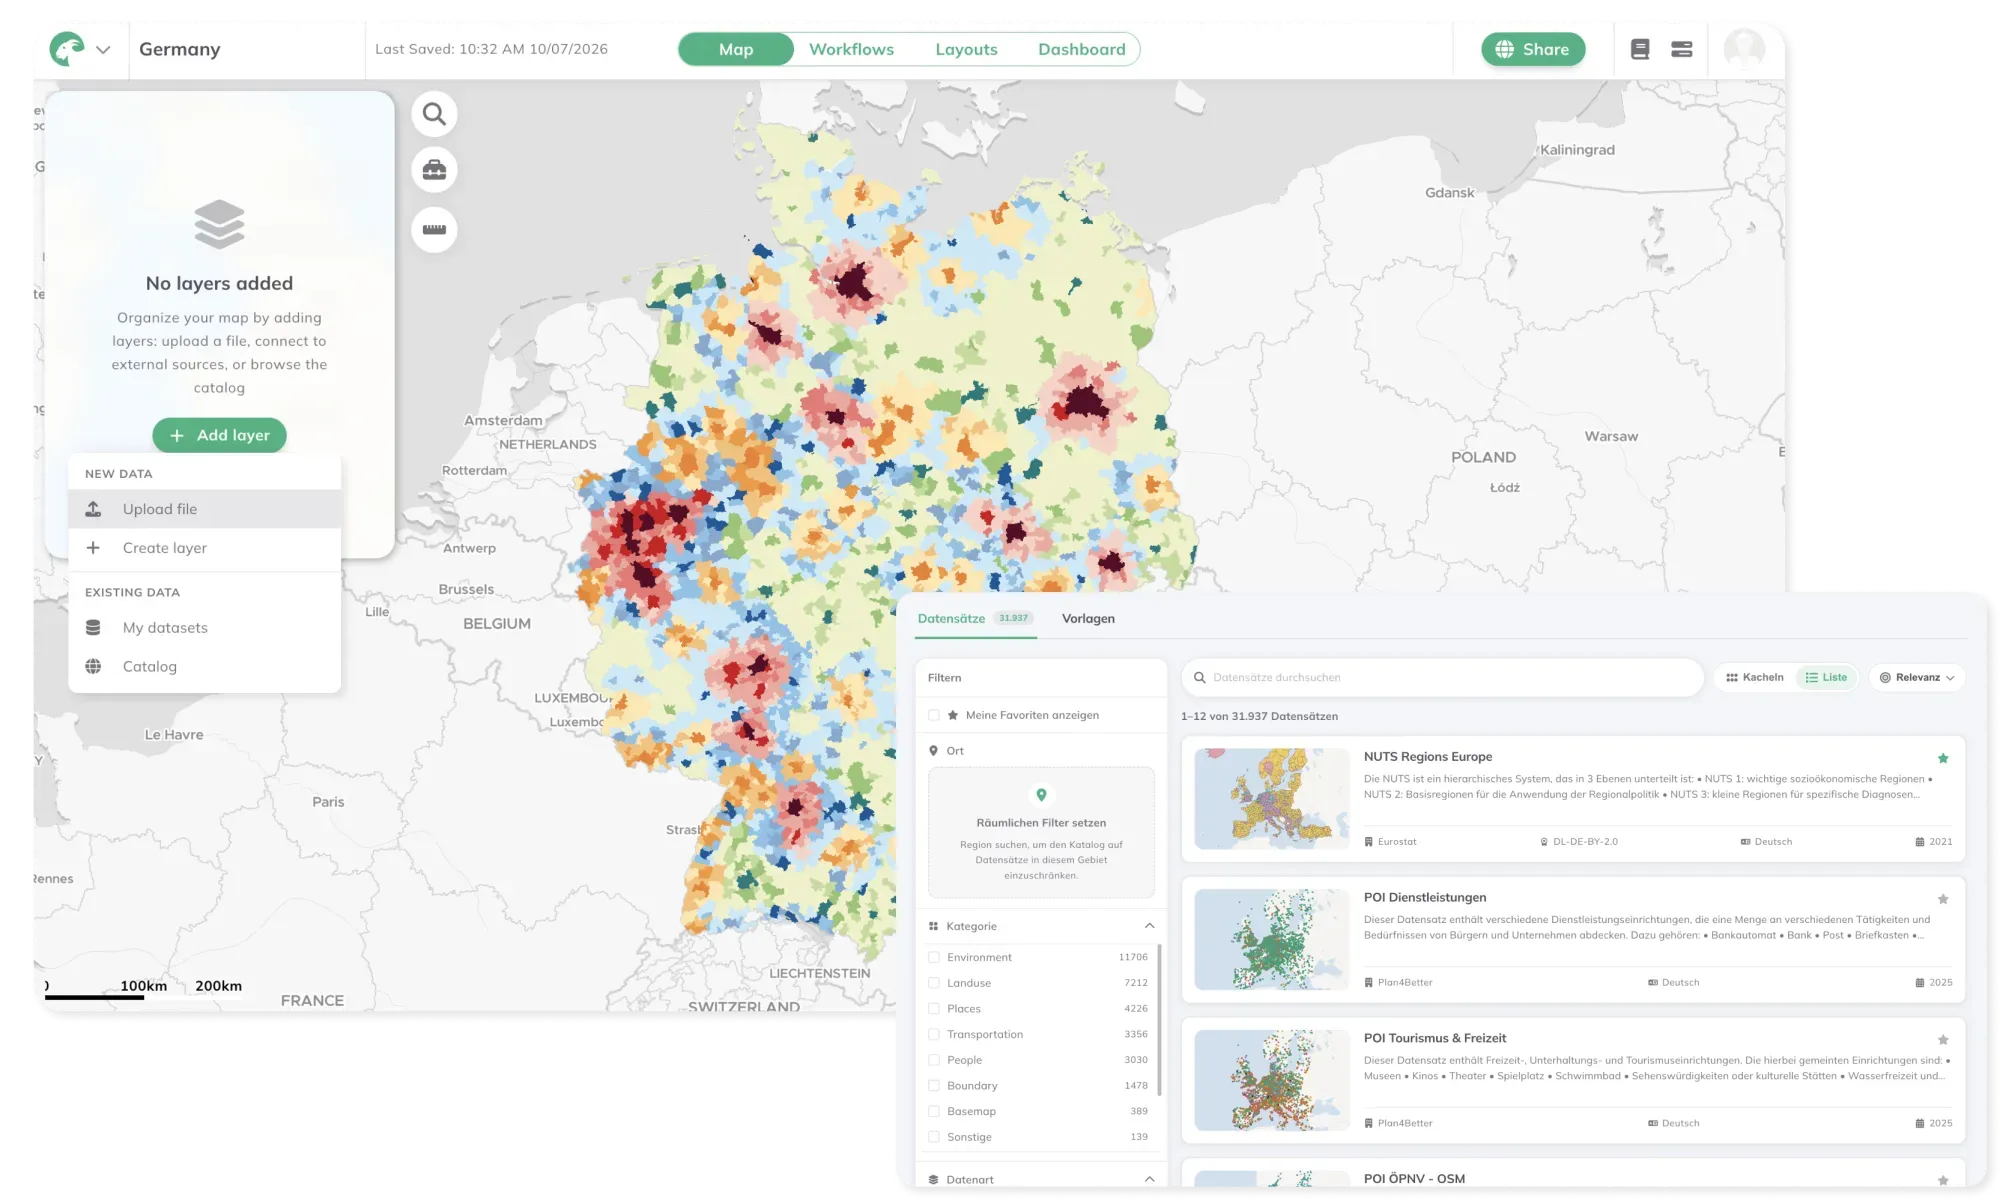
Bring your data together
Upload your own files, connect an external service, or pull from our Catalog of over 30,000 curated datasets. Everything sits in one workspace, ready for analysis.
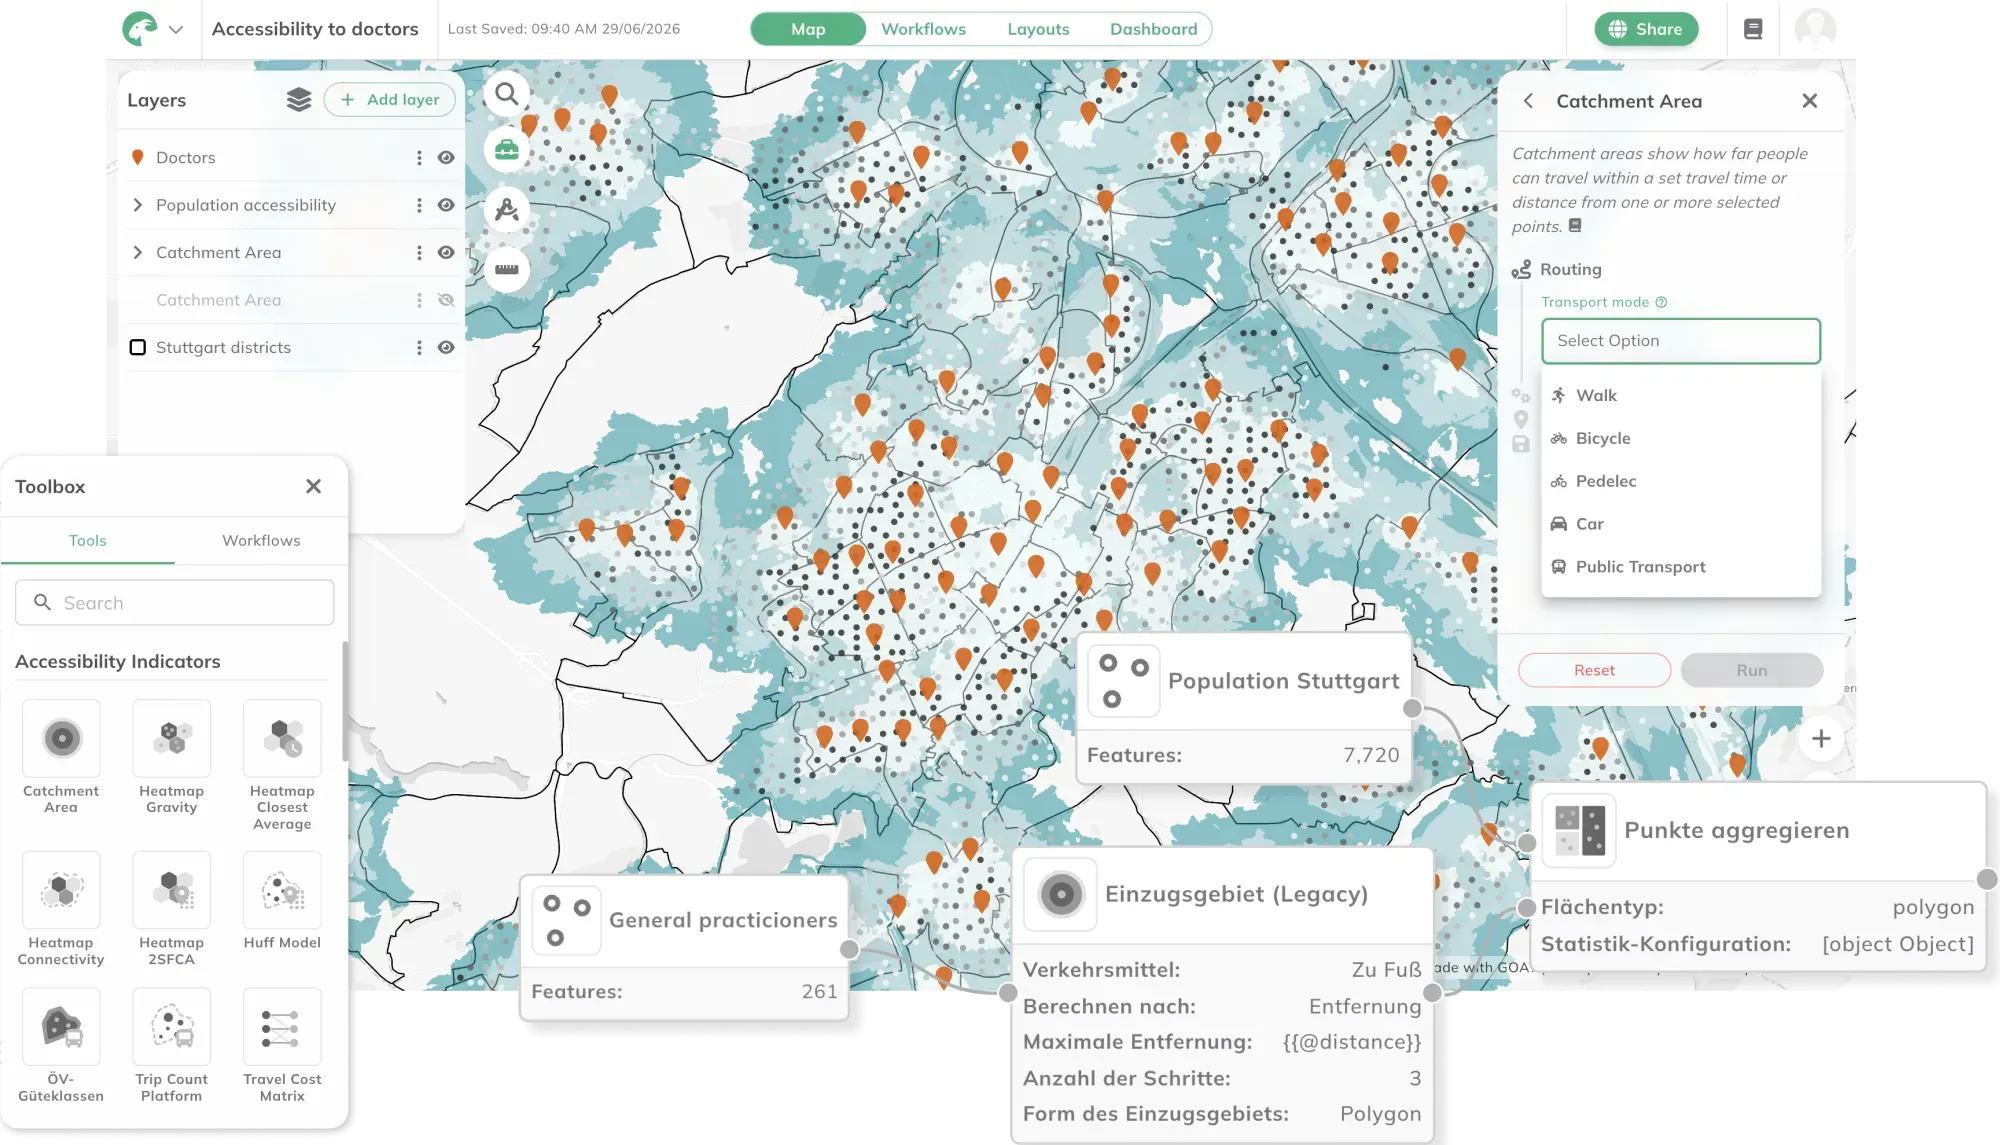
Accessibility and GIS analysis
Answer the spatial questions that used to need a GIS specialist — accessibility, demand, coverage, site selection — in your browser.
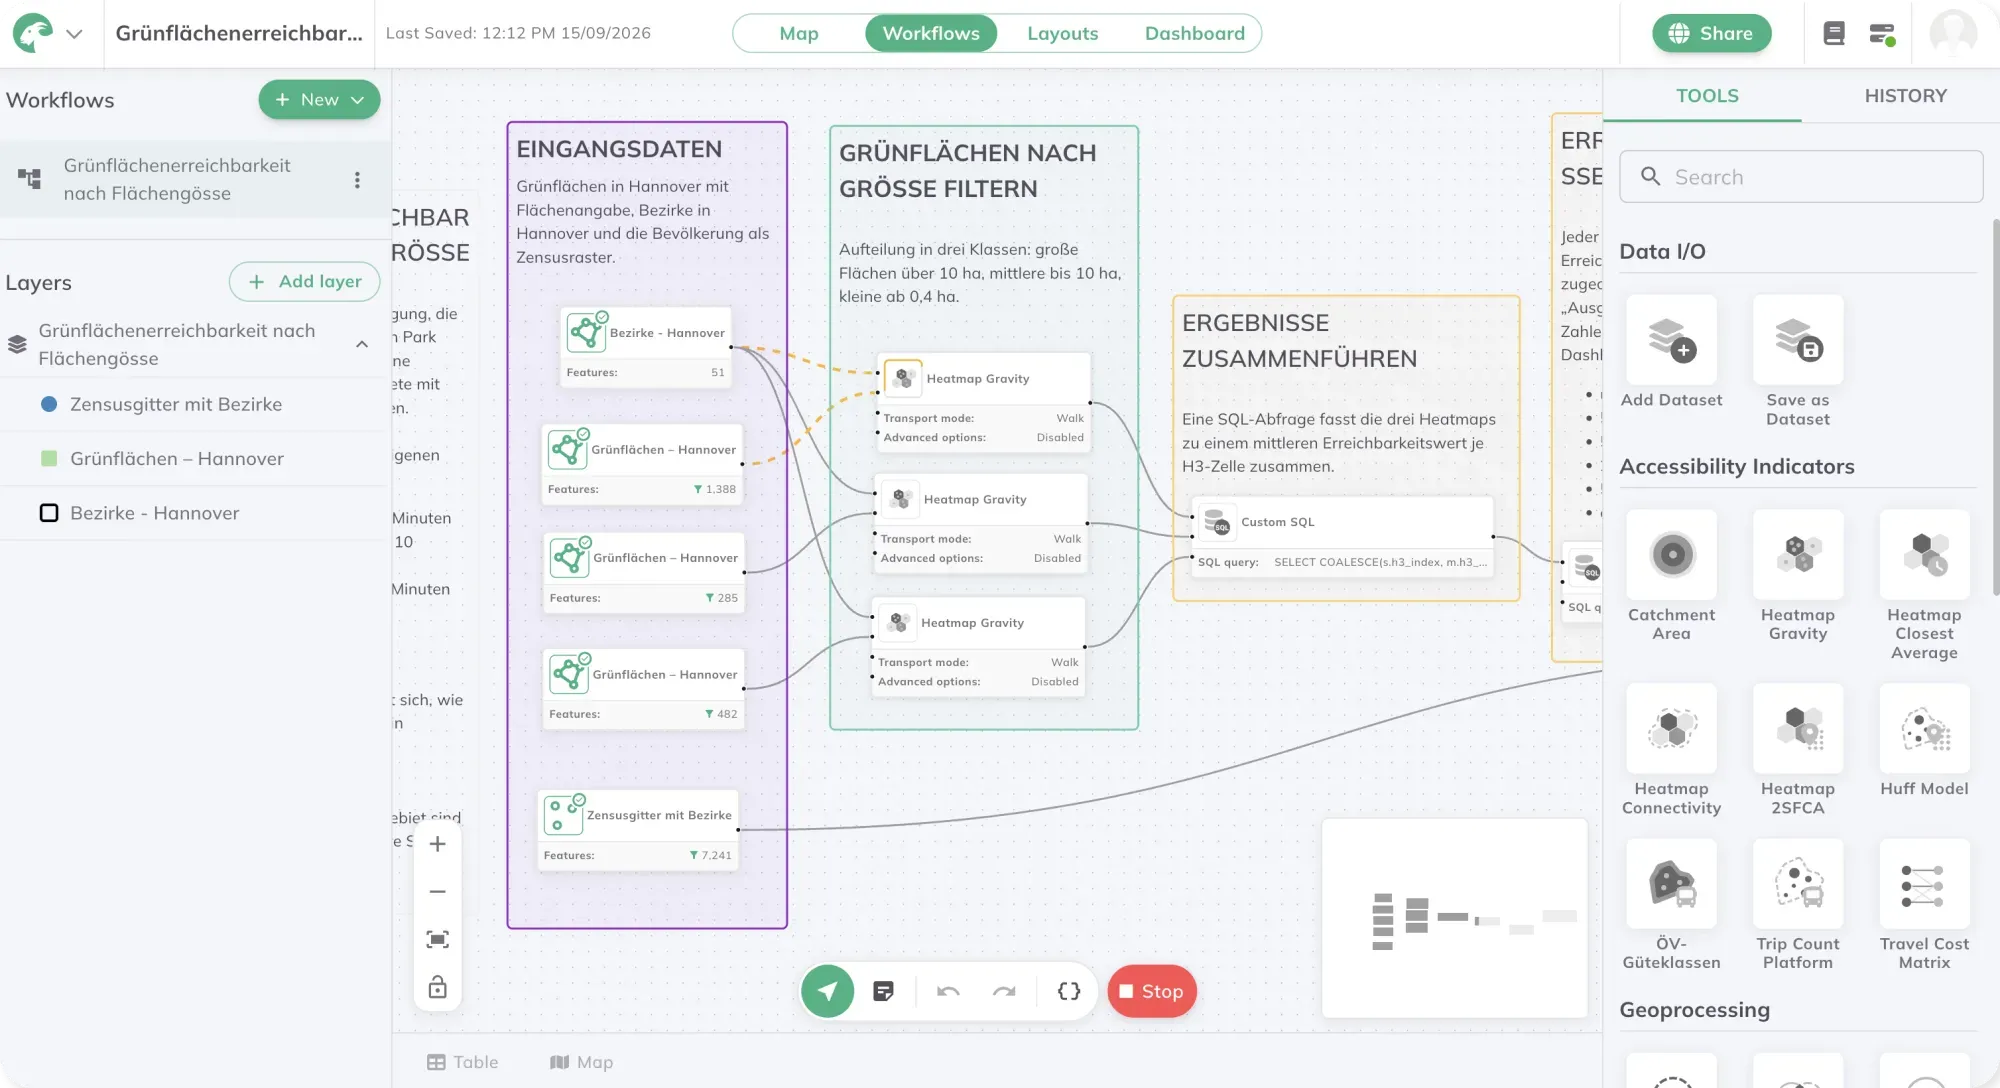
Automate your workflows
Turn a week of manual analysis into a workflow you re-run in a click.
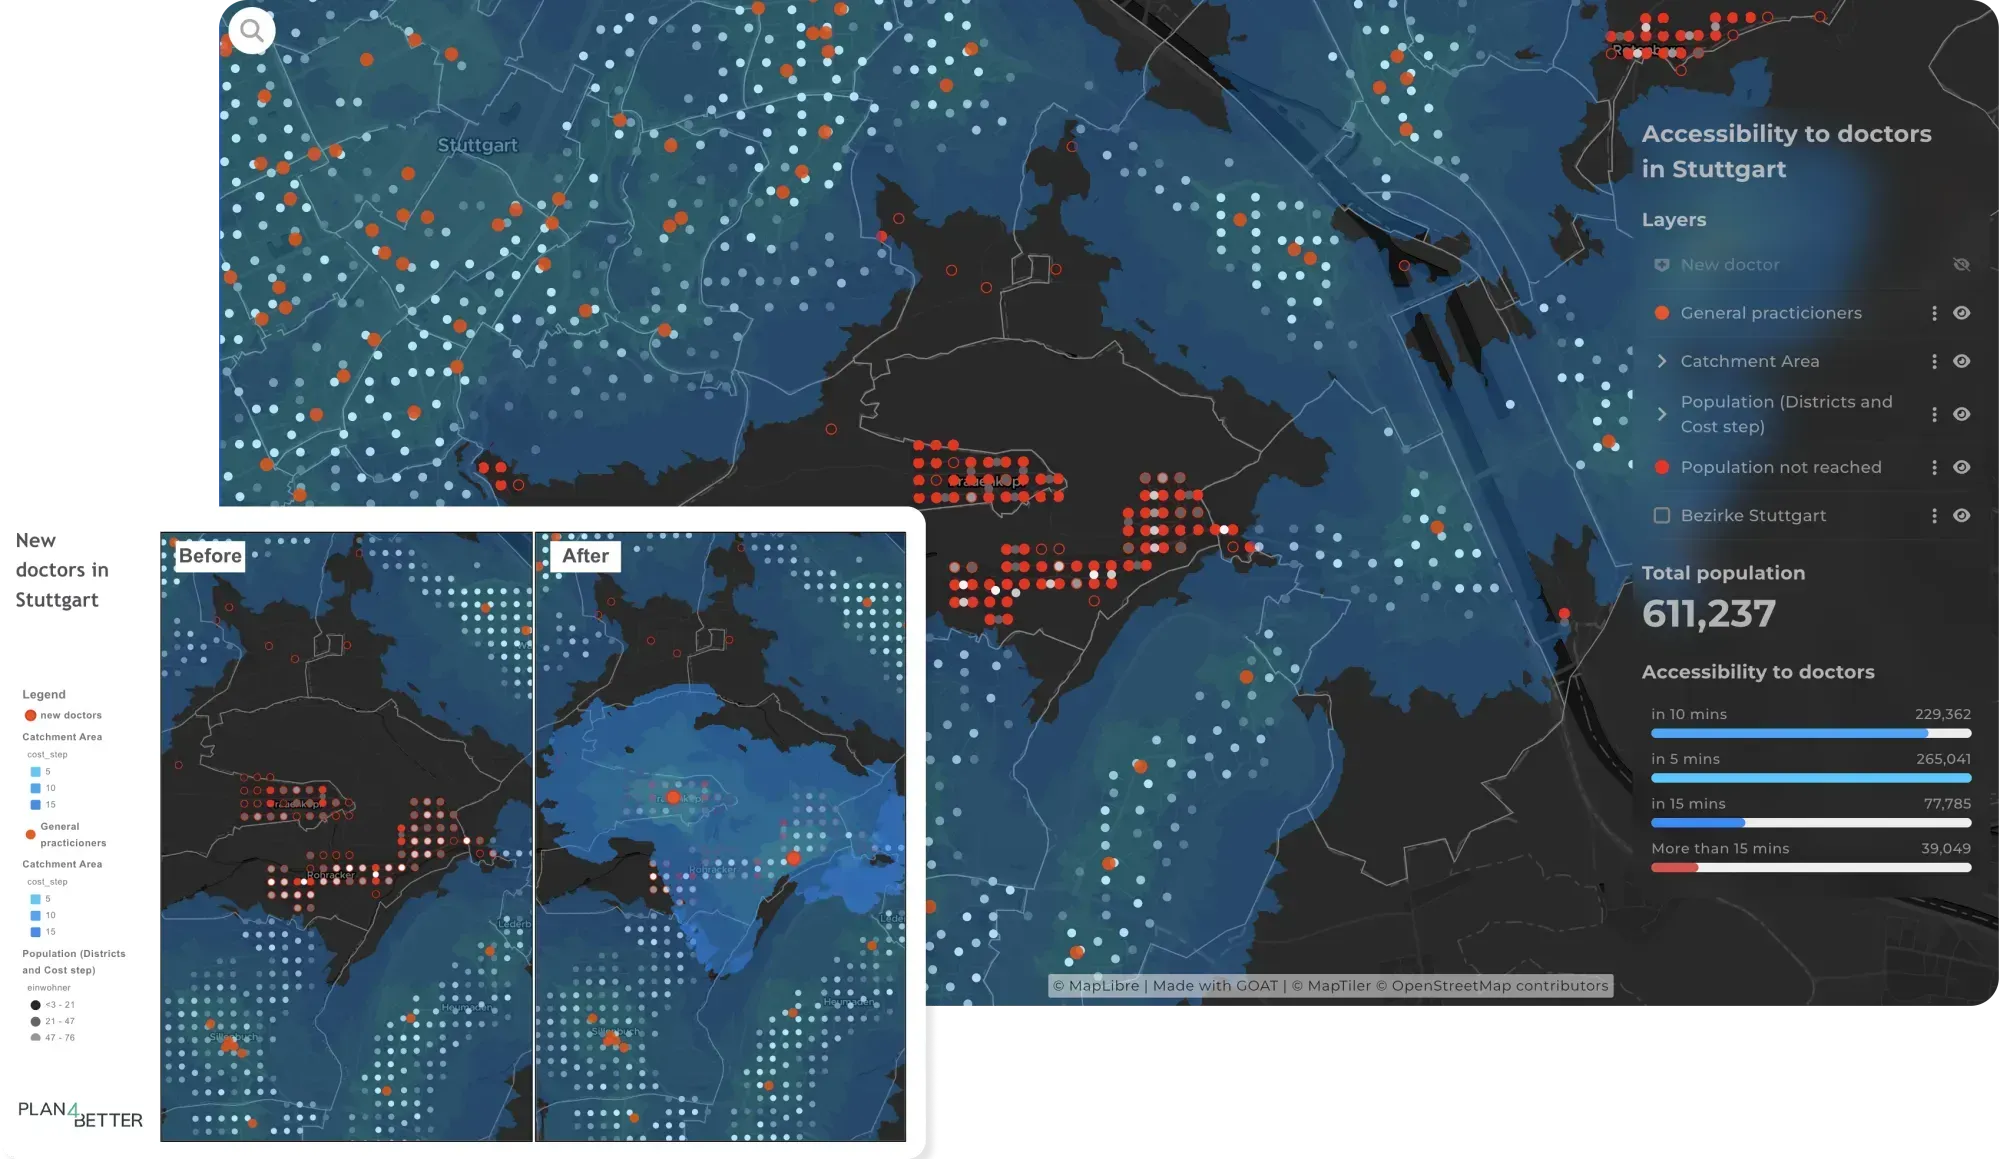
Share and collaborate live
Hand stakeholders or decision-makers a live dashboard instead of a PDF that's out of date on arrival.
Open-source and GDPR-safe
Know exactly what's under the hood — open-source foundations, no black box, no lock-in, and your data stays protected under EU rules.
GOAT in use
What are you planning?
Accessibility analysis, 15-minute-city assessments and service-coverage studies — in the browser, without a GIS department.
More on this industry
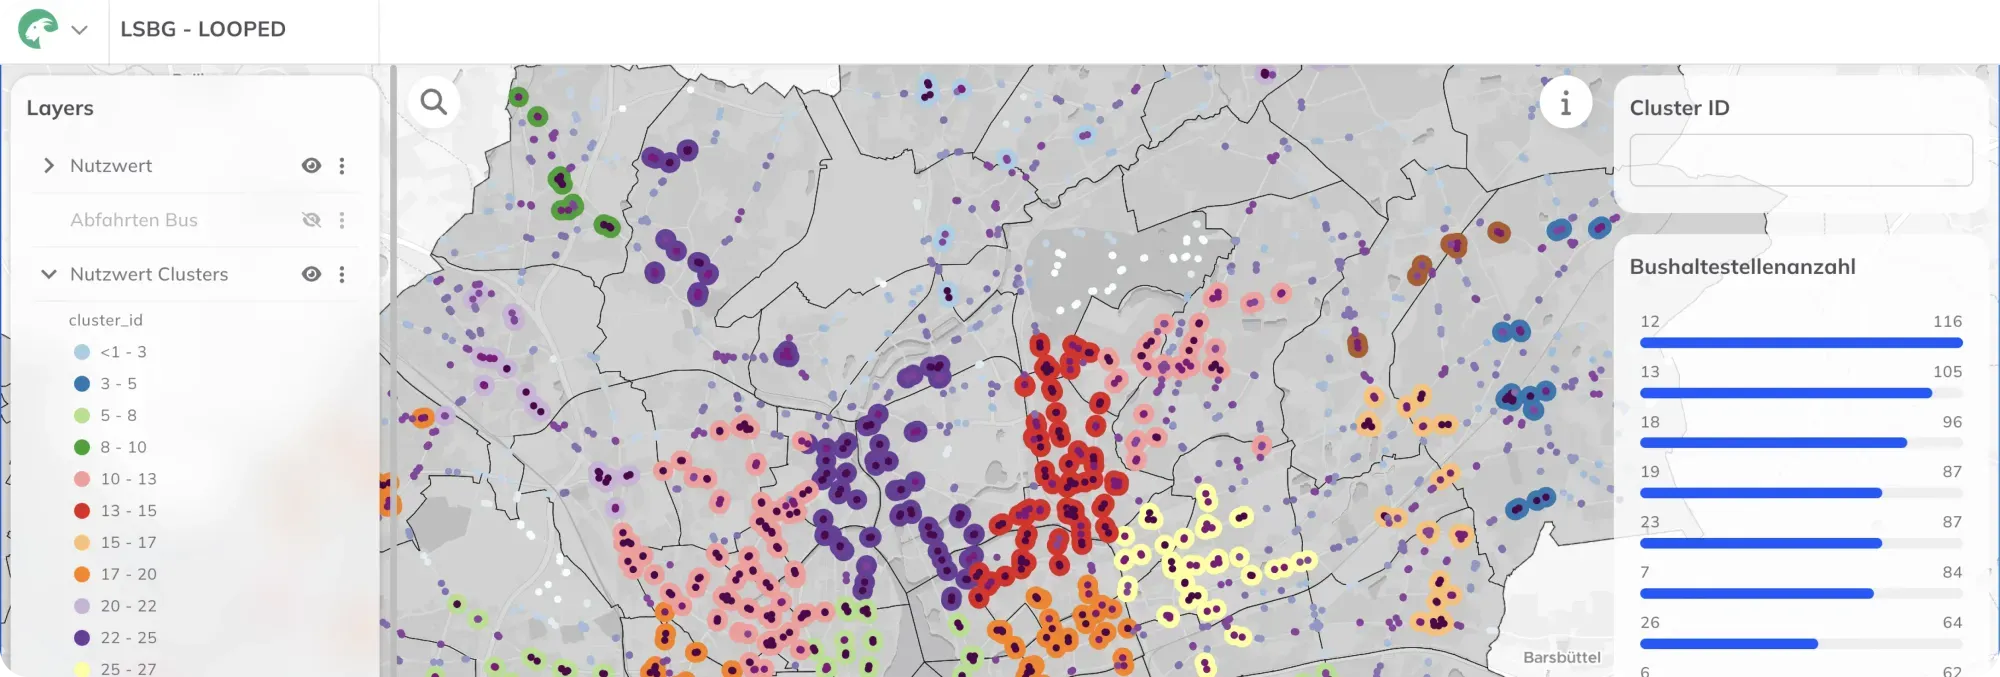
Hamburg is prioritising its barrier-free bus stop retrofits in GOAT
The city's agency for roads, bridges and waterways (LSBG) combines accessibility, timetable data, and sociodemographics in an automated multi-criteria analysis to decide which stops to retrofit first, so limited budget goes where it helps most.
Model catchment areas, test network changes and show decision-makers the effect before anything is built.
More on this industry
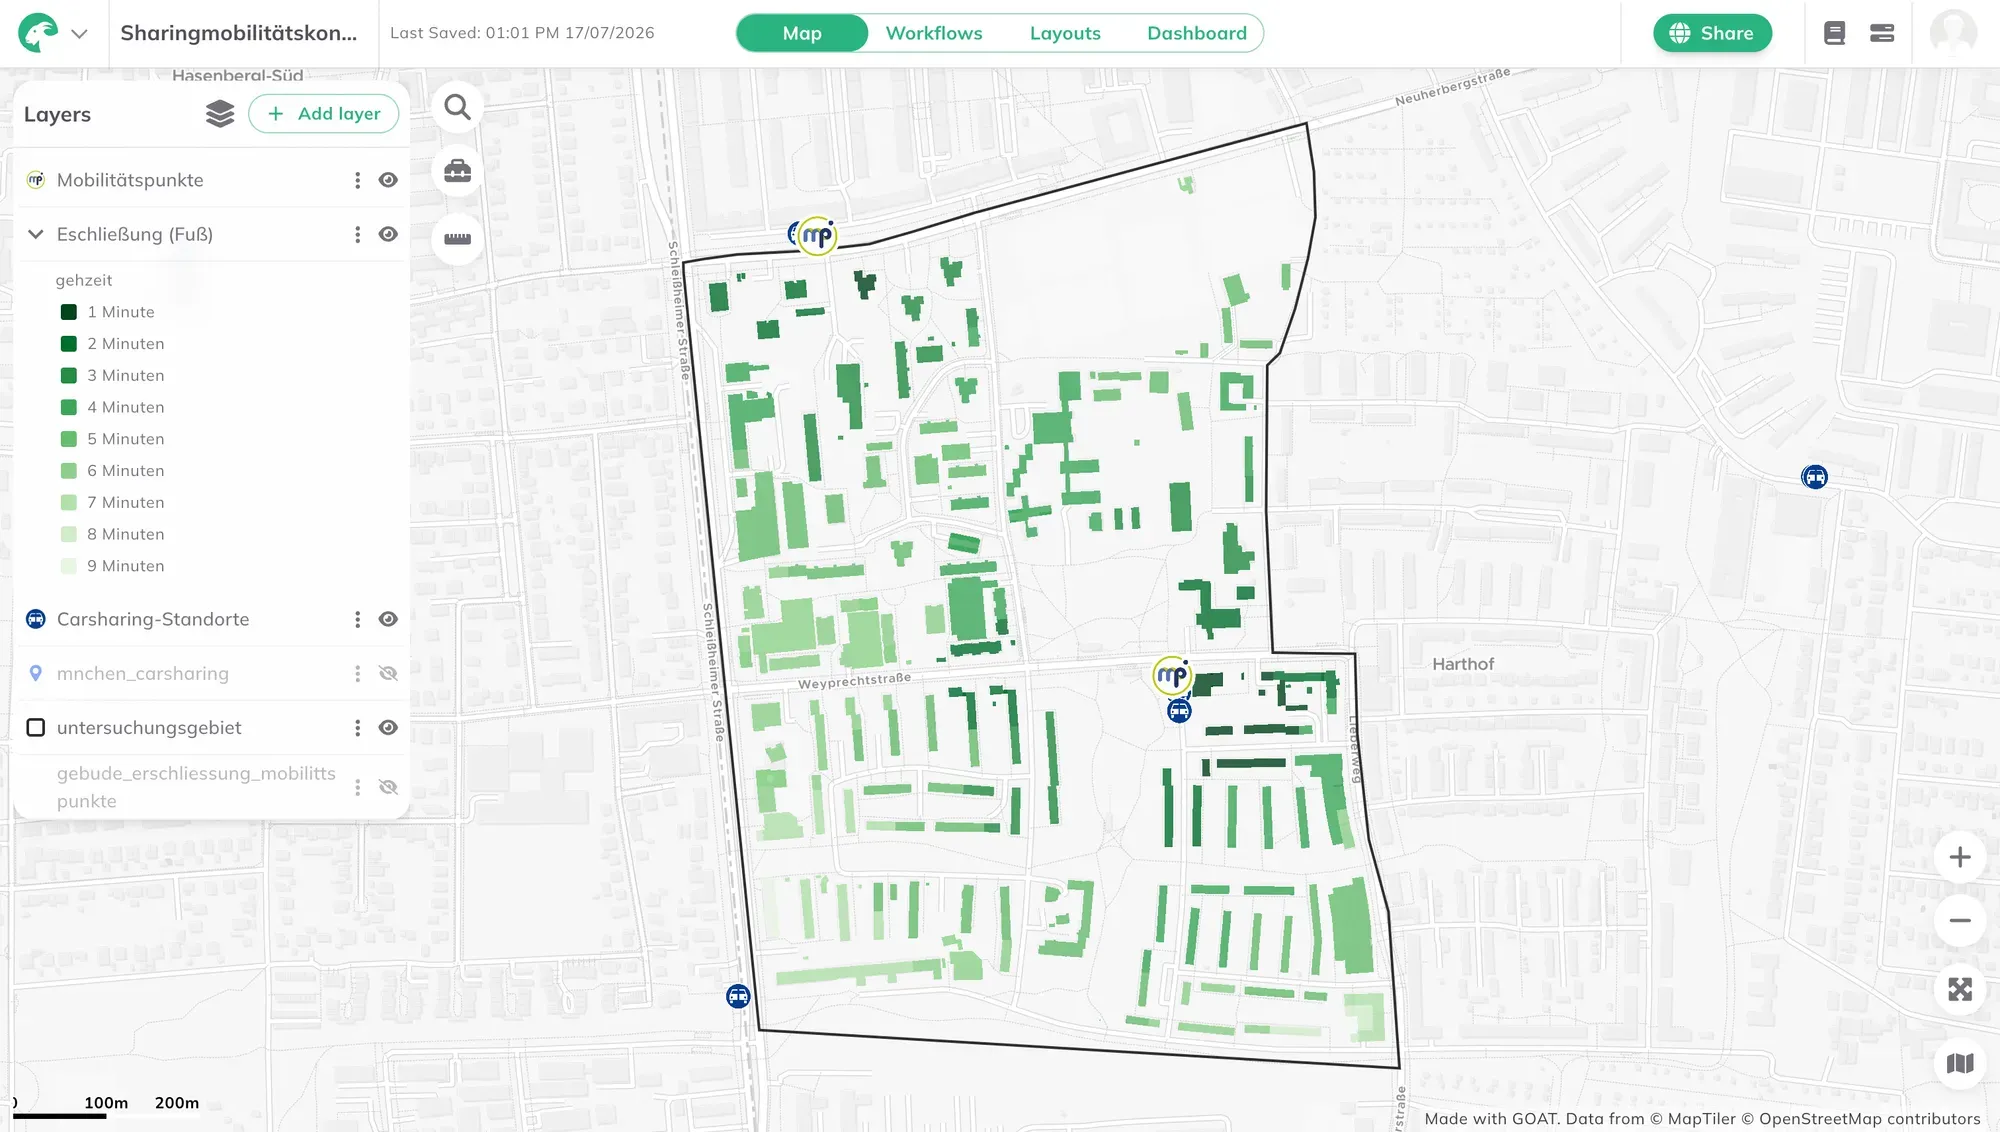
Munich is planning where to put shared mobility in Harthof
For the Harthof district, the City of Munich needed to know which locations would work for car and bike sharing. Using GOAT, walkability and accessibility were analysed, along with the city's digital twin and sociodemographic data to find the spots residents can reach on foot, then modelled scenarios for placing hubs there.
Score a site on who can actually reach it: transport, amenities, catchment, footfall.
More on this industry
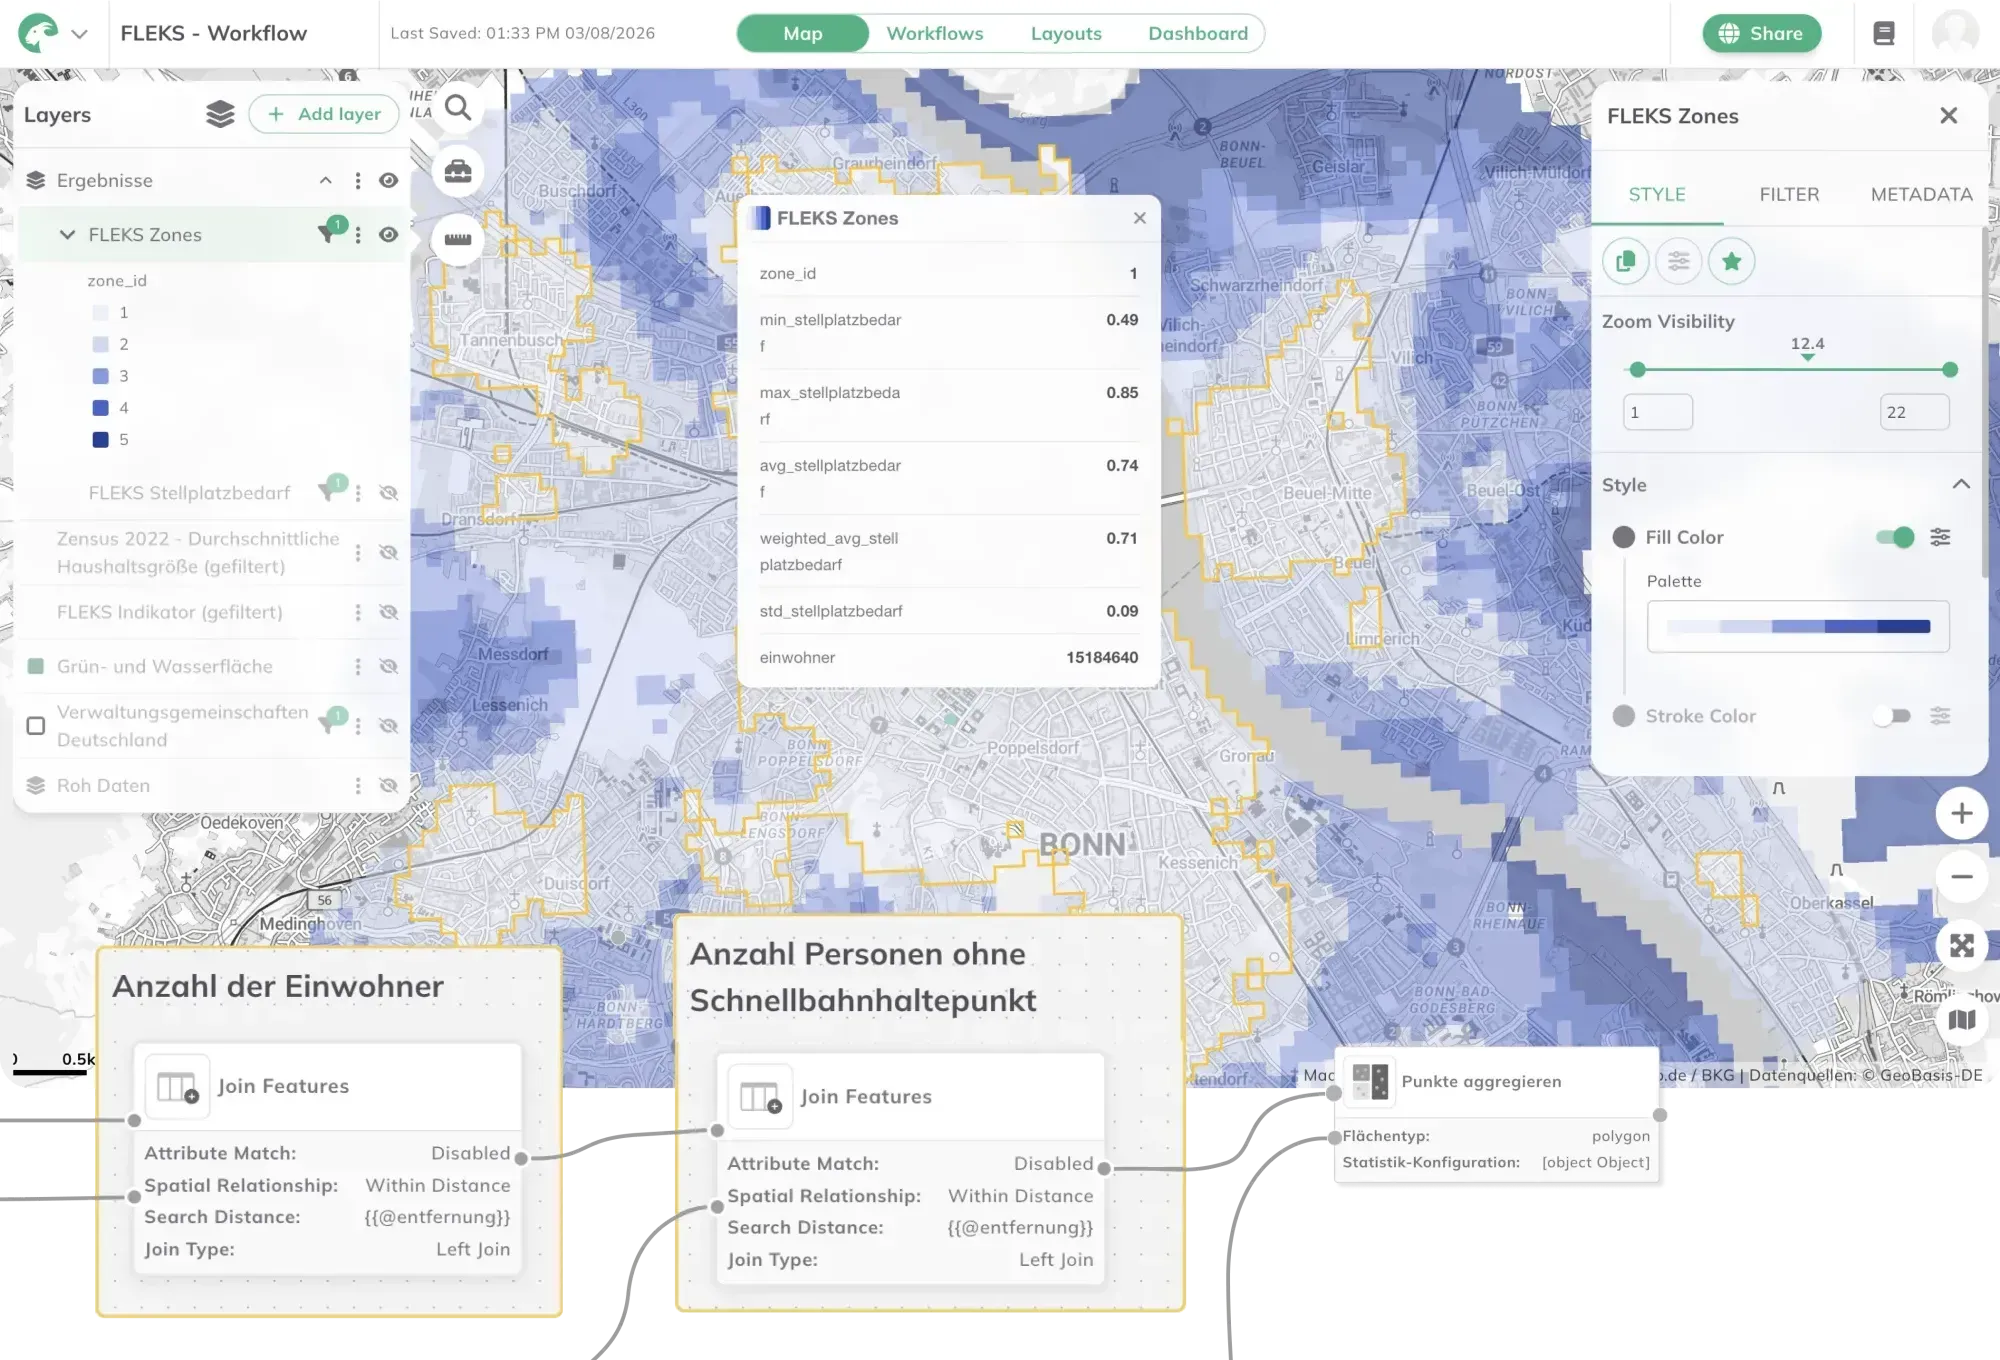
stattbau analyses how well connected housing sites really are
The Munich consultancy has used GOAT since 2022, looking at what people can reach on foot and by transit, bike and car sharing, and testing scenarios for adding services. The results feed mobility concepts for new neighbourhoods and workplaces, including how much parking is actually needed.
Find and defend locations with real accessibility and demand data instead of gut feel.
More on this industry
Bonn is putting retail planning inside its own data platform
The City of Bonn is building a GIS-based retail planning workflow in GOAT, with automated accessibility and local supply analyses running on the city's Urban Data Platform. A question about how well a neighbourhood is served gets answered from data the city already holds.
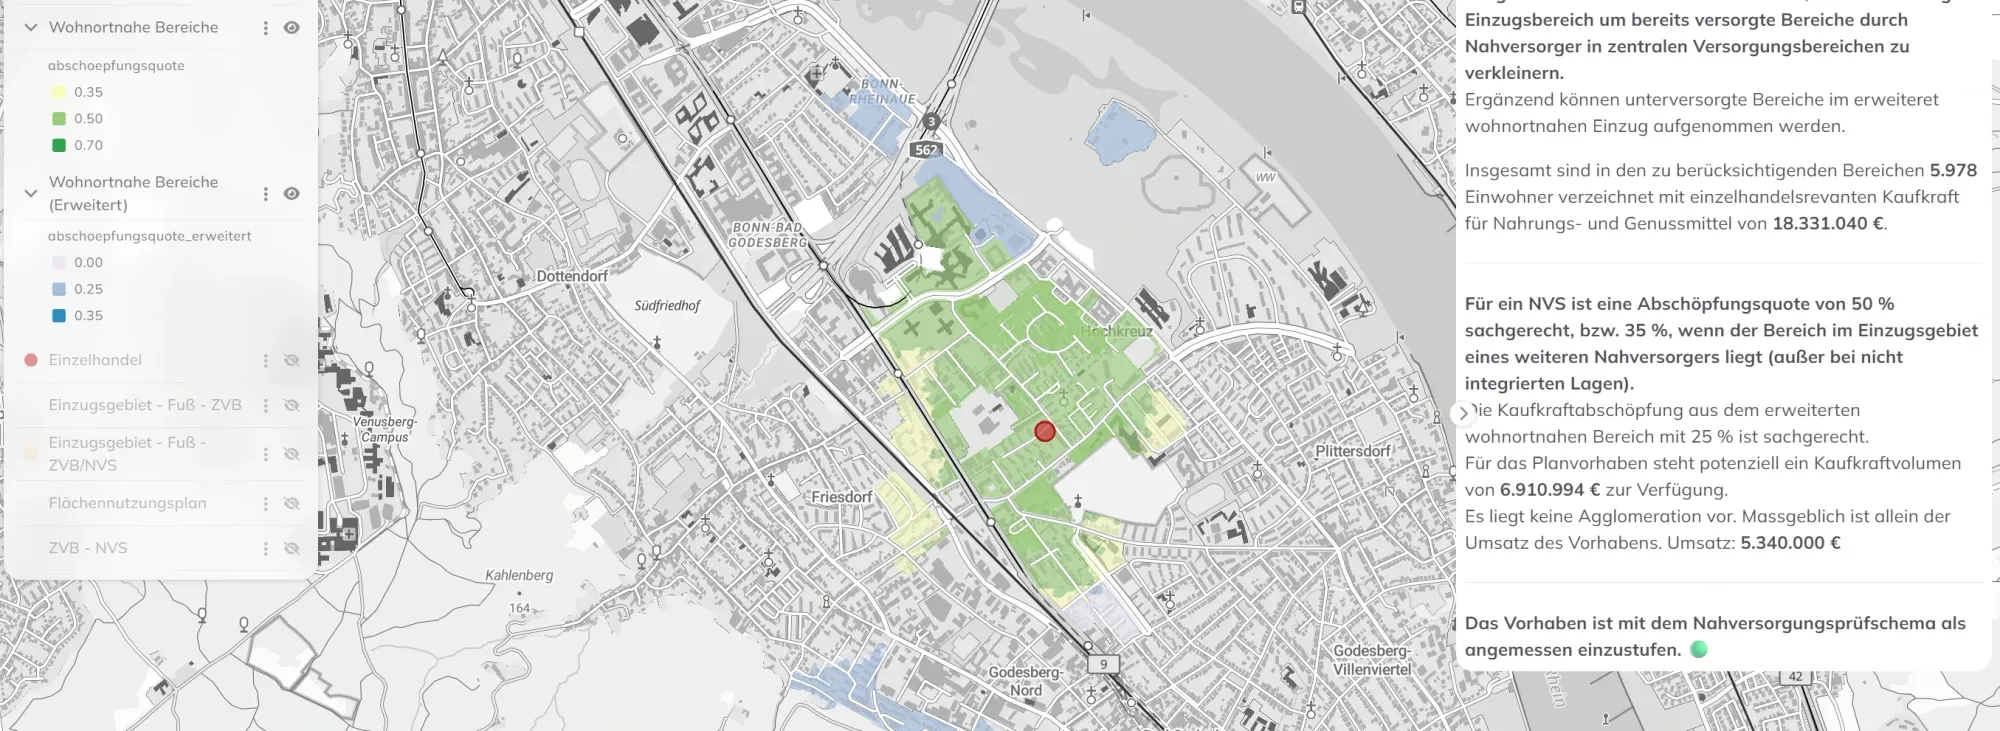
Map exposure, identify underserved areas and evidence your climate and mobility targets.
More on this industry

A national dashboard for tracking how cities are adapting to heat
BBSR is developing Germany's urban climate monitoring system on GOAT, with IÖR, LUP and bauchplan. It tracks nationally comparable indicators, from how many people can reach a green space that actually cools them to how much ground is still permeable. These feed federal monitoring from 2027, to judge whether adaptation is working.
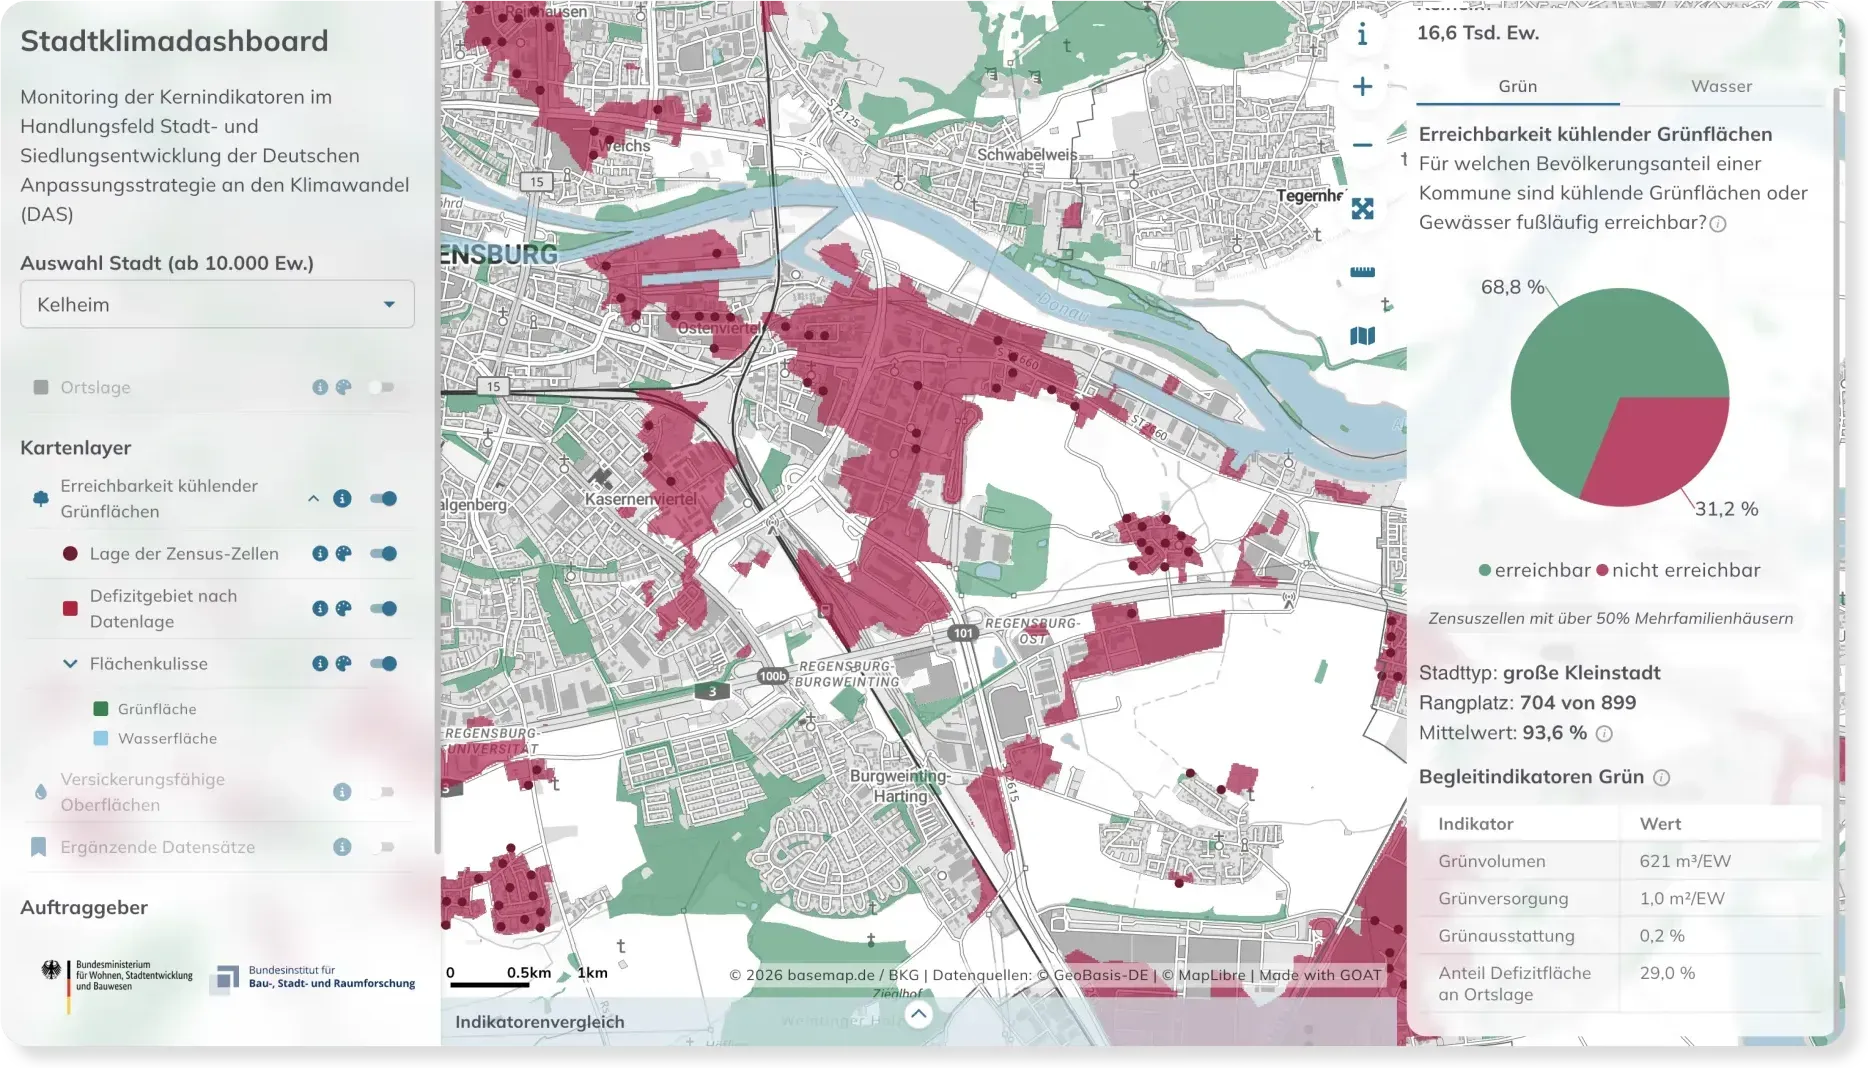
GOAT is also in use inHealthcareEnergy
What they say about GOAT
Testimonials
Please read the testimonials from our satisfied customers, including public authorities, planning offices, consultants, academics and other experts from a range of fields.
“I am enthusiastic about this software solution enabling complex analyses docked to our city-wide systems. What previously ran laboriously and in isolation will now be standardized, cross-departmental and without media breaks. The Urban Data Platform thus becomes the true heart of our urban development – efficient, transparent and forward-looking.”
 Janina EderSpatial PlannerCity of Bonn
“With Plan4Better, we have fundamentally modernised VerkehrsInfo BW. The new platform brings together a wide range of mobility data and makes it available clearly and reliably. Its open, scalable architecture also creates a strong basis for continuous further development.”
 Marlene PichaInnovation ManagerNVBW - Nahverkehrsgesellschaft Baden-Württemberg mbH
“An excellent tool for data-driven, modern urban and mobility planning for ambitious 15-minute cities.”
 Dr. Michael BauderCity of Freiburg
“GOAT enables us to analyse the accessibility of construction projects in a targeted and efficient manner. The results of the analyses form a clear basis for the development of tailored mobility concepts in residential and commercial construction.”
 Julia KorstenProject ManagerStattbau München GmbH
“GOAT brings great added value to answering complex planning problems in the mobility sector through intuitive and fast analyses with visually appealing and easy-to-understand results.”
 Shravan ShindeConception & ConsultingMünchner Verkehrs- & Tarifverbund GmbH
“With Plan4Better, we were able to answer our specific questions regarding a nationwide mobility guarantee. We also very successfully realised the internationalisation of the public transport atlas together.”
 Philipp KosokPublic Transport Project ManagerAgora Verkehrswende
“With the implementation of GOAT as part of the Rhine-Neckar Smart Region project, we are aiming for a transformative change in our transport infrastructure. The tool enables stronger connection and collaboration between different stakeholders in our region, contributing to an integrated and sustainable transport system.”
 Marius JörresProject Manager for Smart MobilityMetropolregion Rhein-Neckar GmbH
“A trend-setting support for the implementation of the 15-minute city!”
 Jonas BellingrodtUrban PlannerCity of Freising
“In Fürstenfeldbruck, GOAT is used in urban and transport planning and is a great help for accessibility analyses on walking and cycling.”
 Dr. Montserrat MiramontesMobility ManagerCity of Fürstenfeldbruck
“We see GOAT as an innovative and cost-effective analysis tool for finding good arguments in favour of future-oriented, modern mobility. Thanks to the excellent support provided by the Plan4Better team, we were able to obtain a quick and comprehensive overview of the transport accessibility of all important points of interest in our Amberg city centre. Be it on foot, by bike or by car.”
 Ulrich SchallerHead of the Mobility and Transport DepartmentCity of Amberg
“GOAT has decisive advantages for environmentally sound urban, local and spatial planning because it includes the user perspective from the outset and does not represent the expert view first. This is new!”
 Dr. Johannes GnädingerProf. Schaller UmweltConsult GmbH
“GOAT is a very good tool for calculating and visualising accessibility in transport and urban planning.”
 Attila LüttmerdingHead of Mobility Data UnitDepartment of Mobility, City of Munich
Get started with GOAT
3 ways of working with us
We build GOAT, and we use it for our own planning projects. So you can take the tool and run with it, or leave the work with us.
Use GOAT yourself
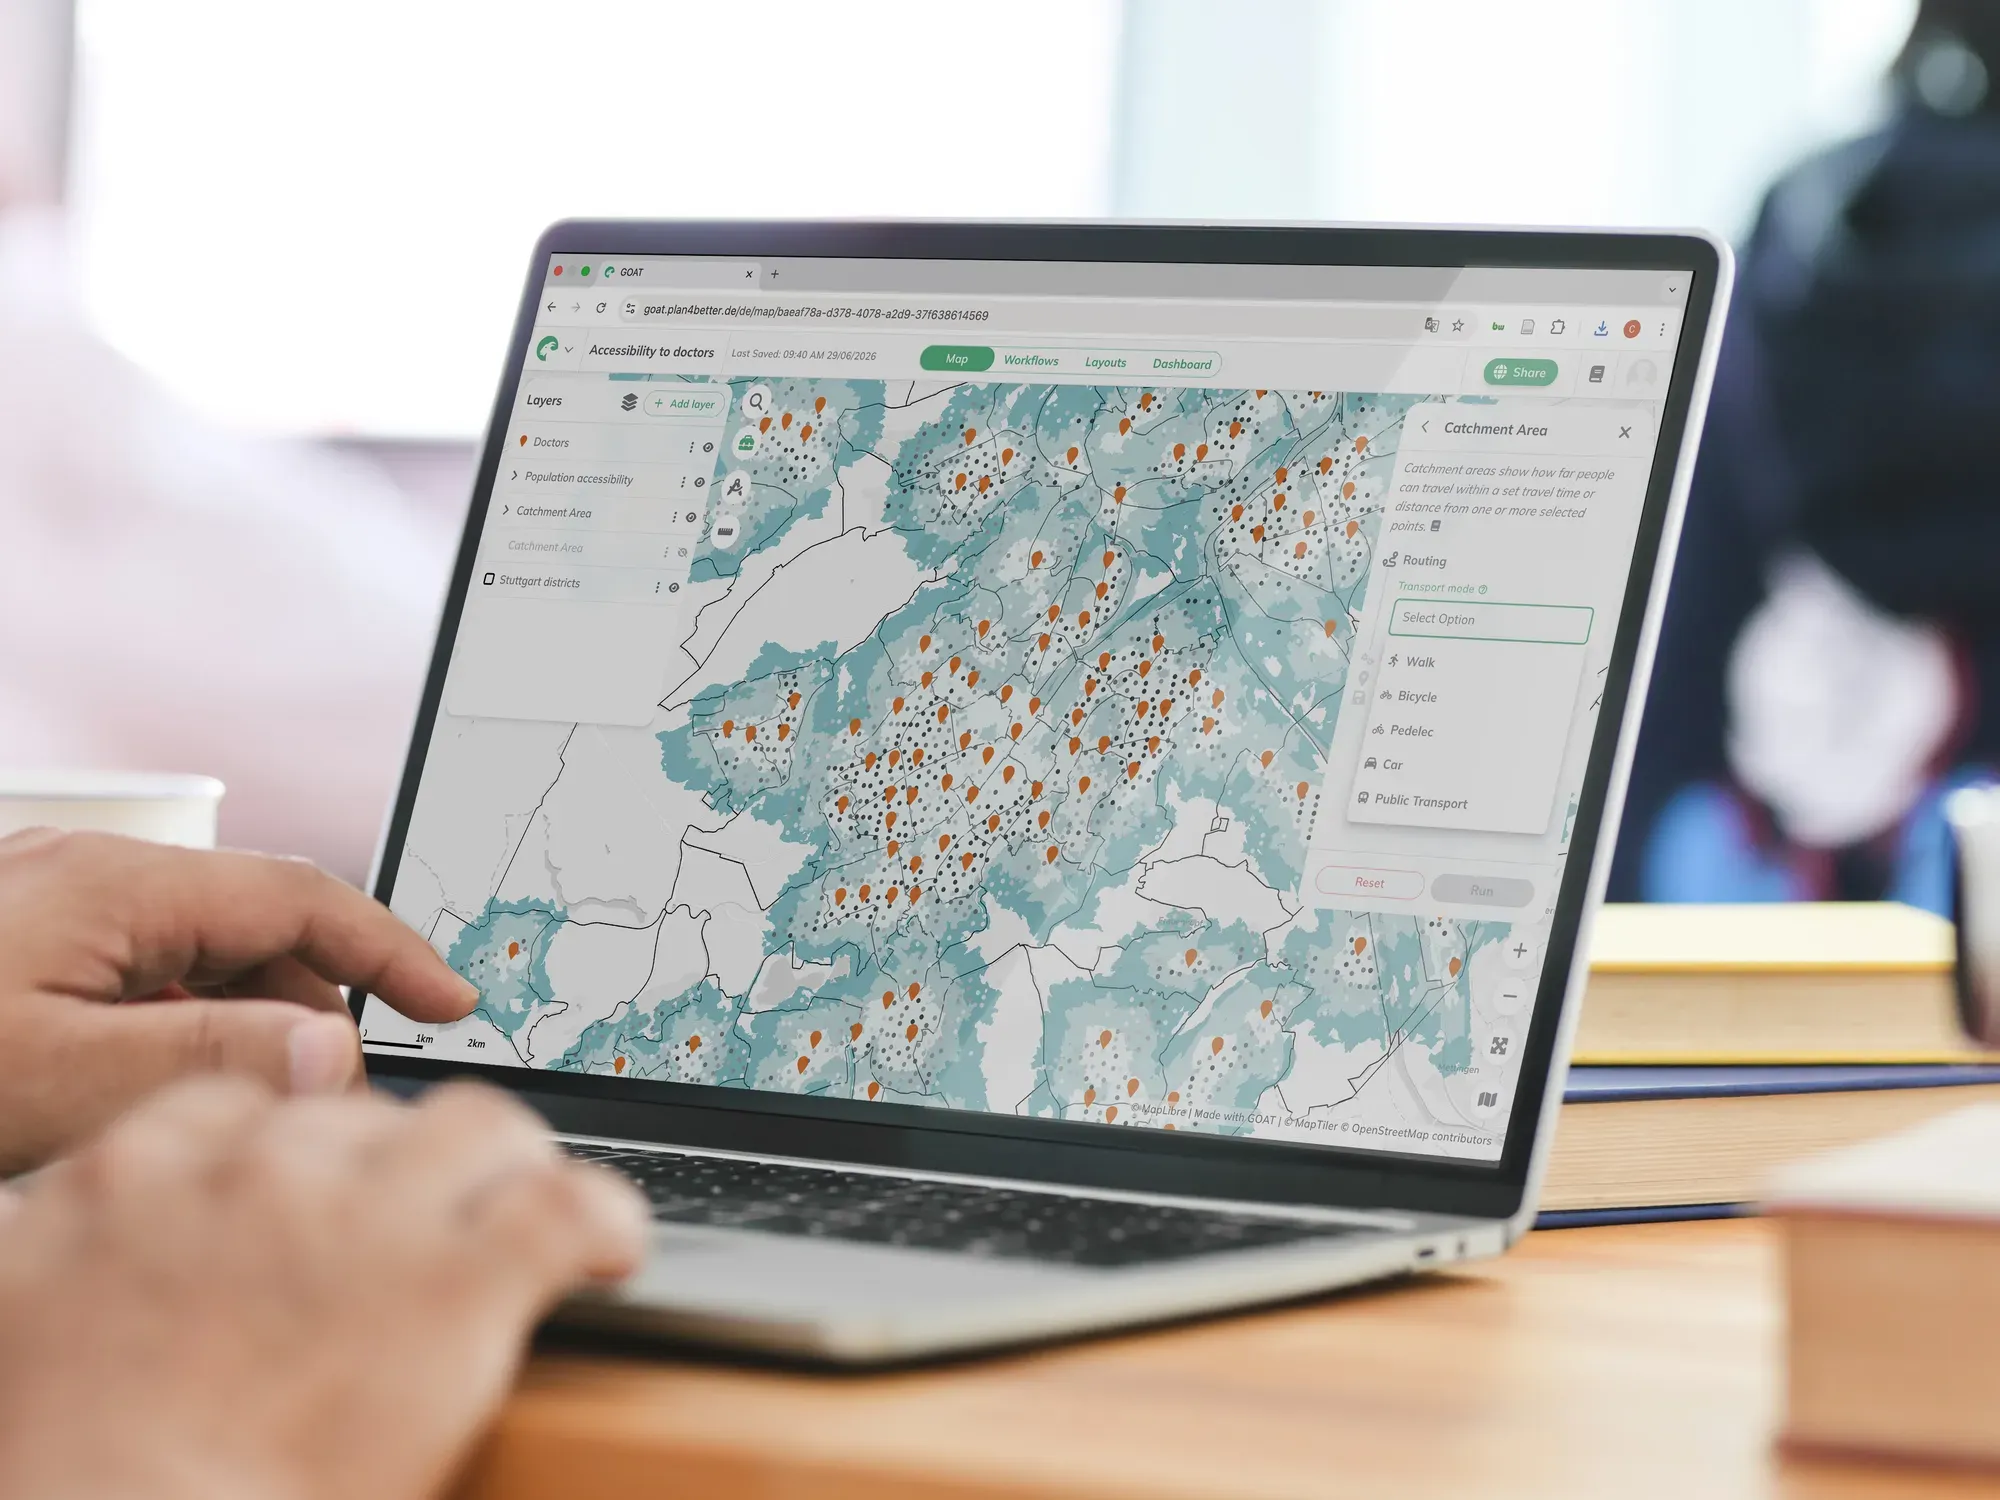
Subscribe, run, and automate your own geospatial analyses, and share maps & dashboards.
Try GOAT for free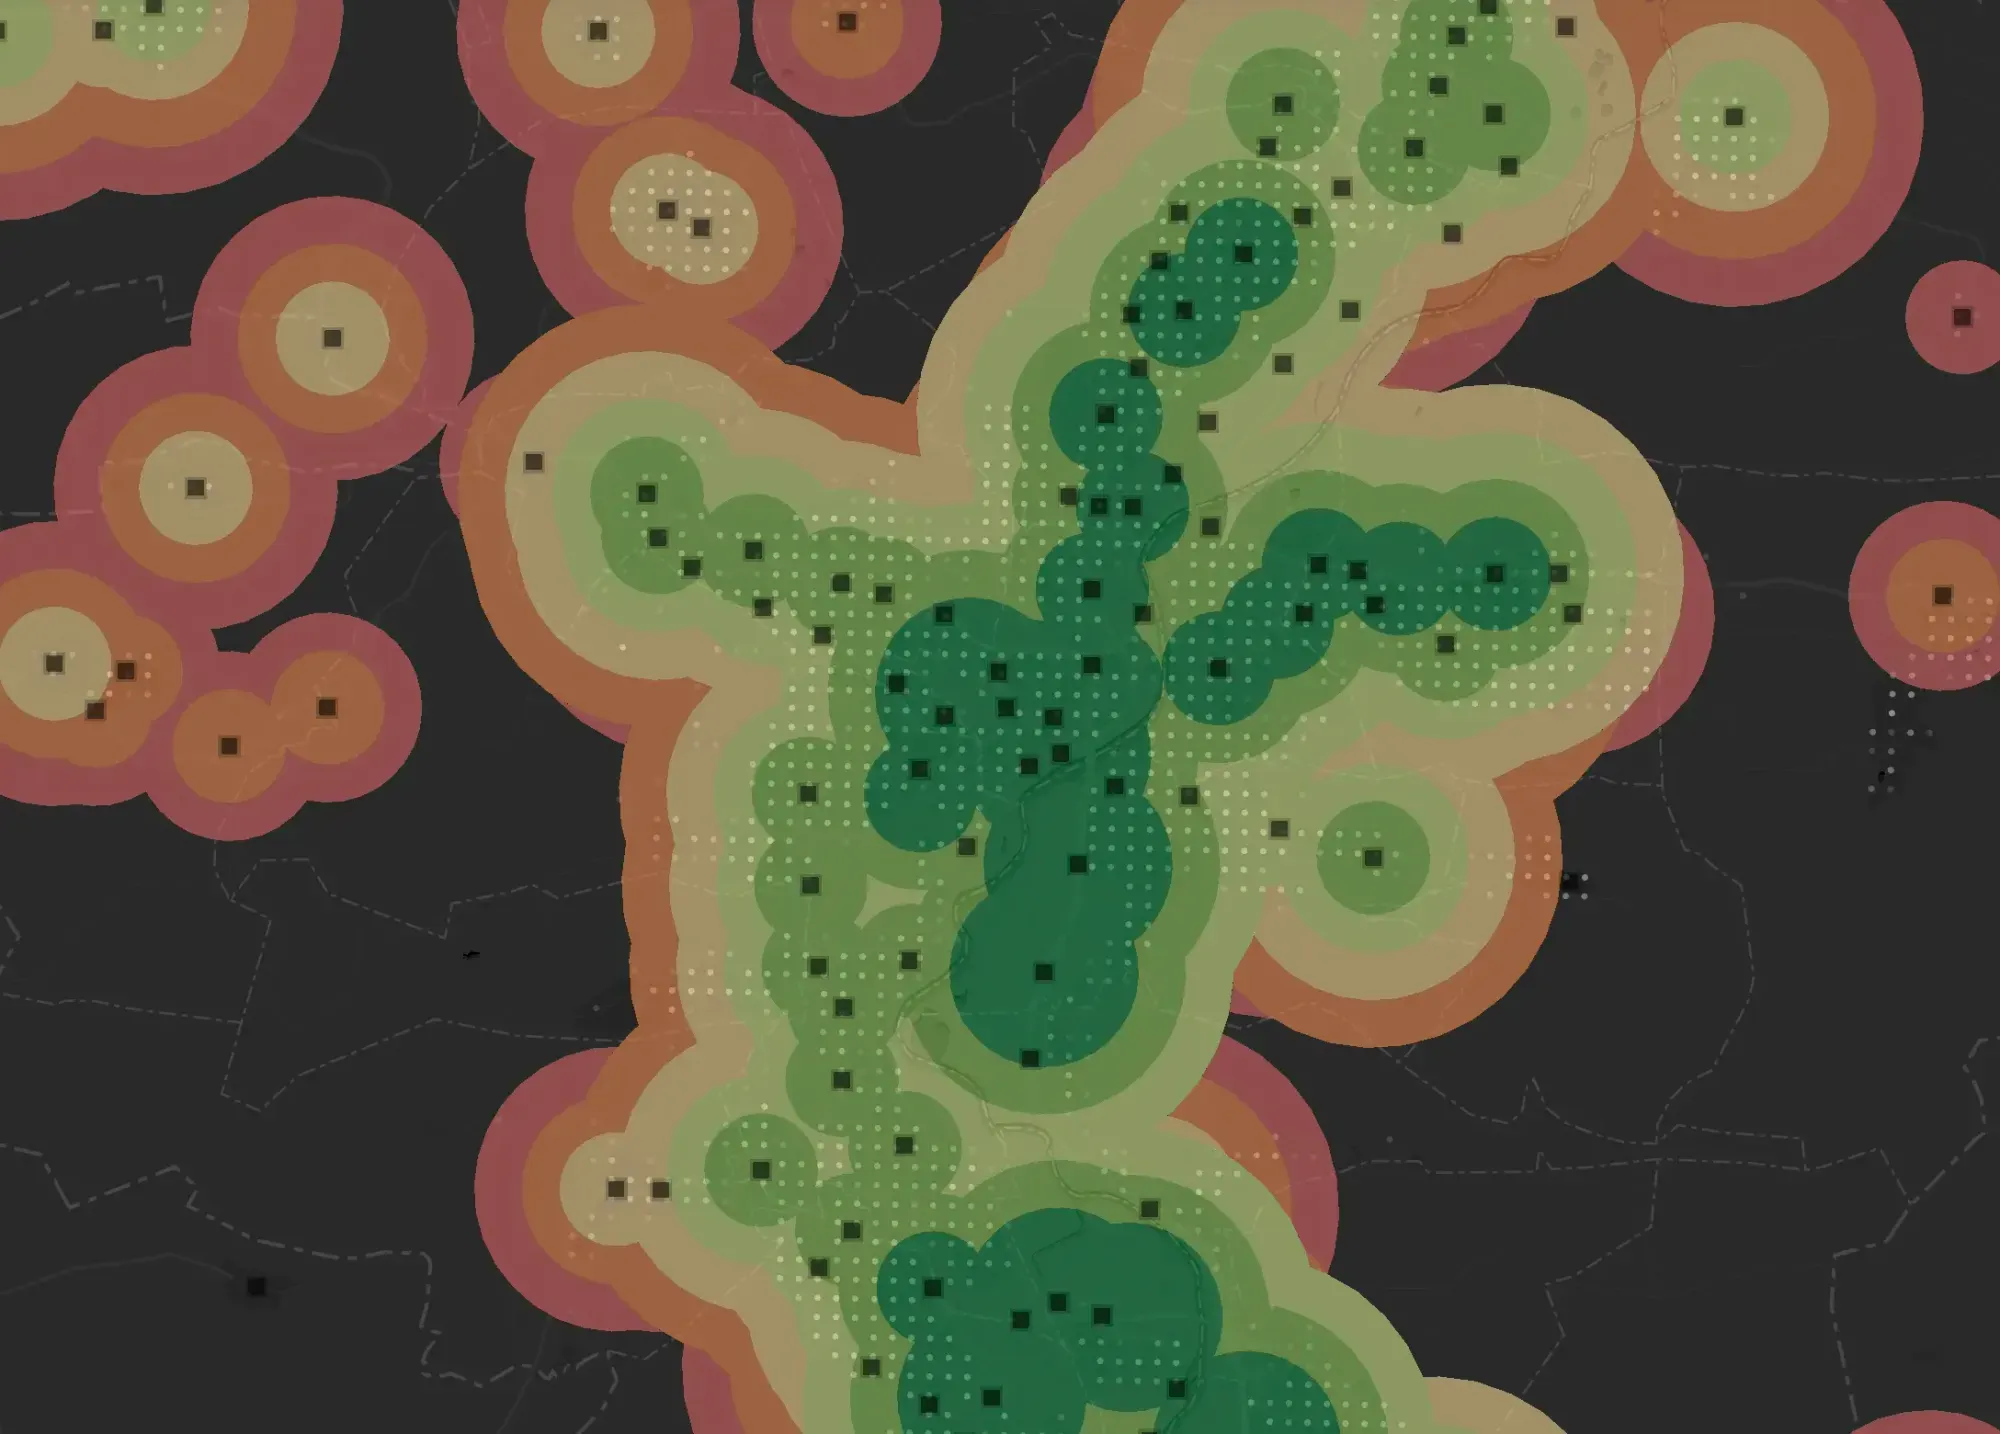
We analyse it for you
Tell us the question, we run the analysis in GOAT and hand you a finished study.
Contact us
We build it for you
Need something tailored? We build custom tools and dashboards on top of GOAT.
Contact us
Check out our resources
Between projects and GOAT releases, we write about what we find.
Articles on our Blog
Analysis examples, method write-ups, map design, and the problems we ran into building them.
- GOAT v3.0: 30,000 datasets, project templates, and your own routing network
GOAT 3.0 brings a catalog of over 30,000 datasets, project and workflow templates, rebuilt content management, and accessibility analyses on your own routing network.
- How do cities and municipalities use climate indicators to shape their decisions?
European cities are publishing more climate indicators than ever - as maps, dashboards and sensor networks. A look at some that end up as the basis for actual decisions, from the Netherlands and Karlsruhe to Vienna and the Stadtklimadashboard
- Detail on demand: how to design and build pop-ups for your maps
How to design and build map pop-ups: when to use them, what to include, and how to create custom pop-ups with blocks, HTML, and AI.
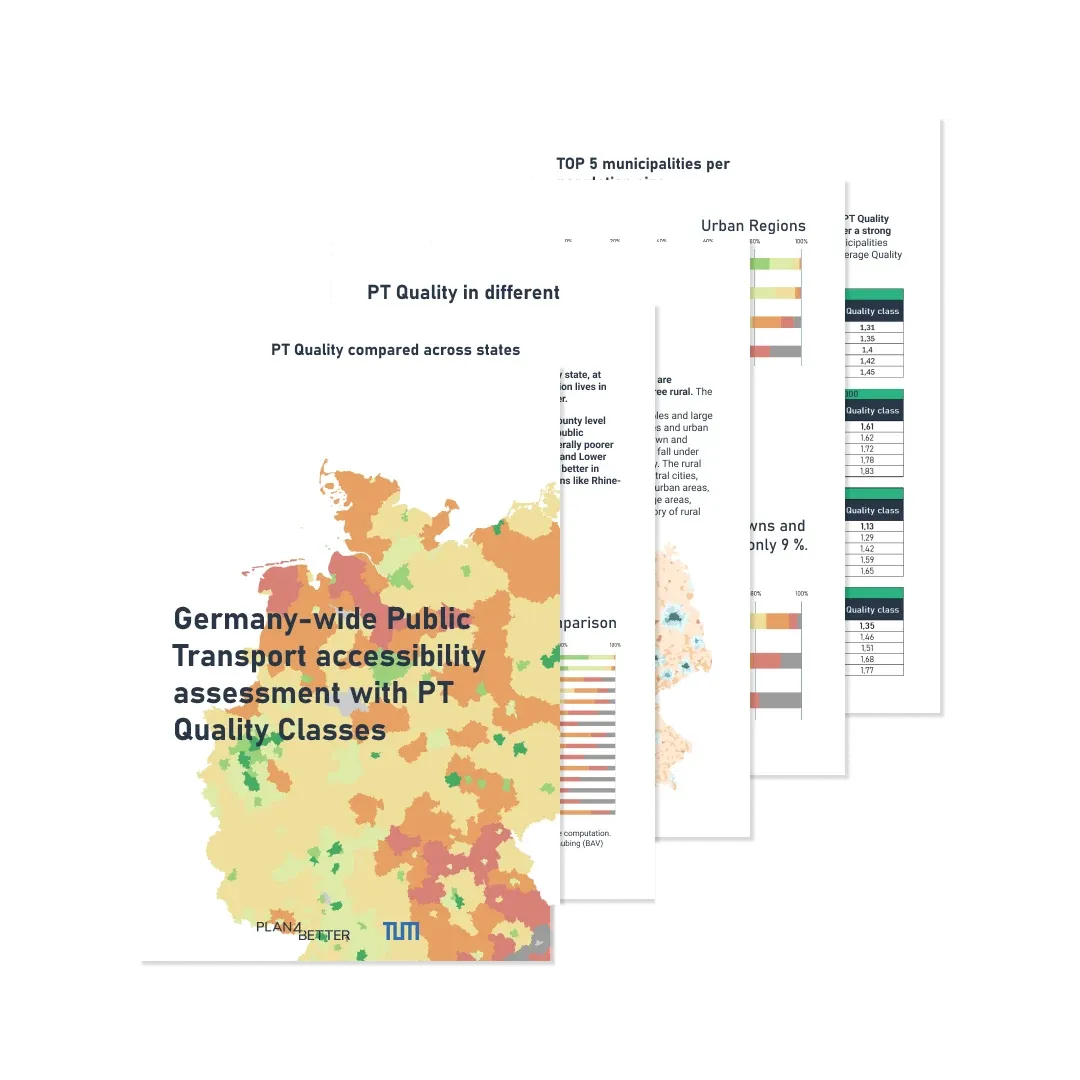
Whitepapers
Longer pieces: how public transport quality is measured, and how a 15-minute city is actually calculated.
Read the whitepapersNewsletter, monthly
What's new in GOAT, recent analyses, and what we're learning along the way.
SubscribeReady to make sense of your data?
Join planners, organizations and cities using GOAT to make better decisions, faster. No GIS expertise needed.