Insights

An increasingly aging population, declining pensions and rising costs for mobility as well as the concentration of food retailing raise the question of an appropriate local supply strategy. In this context, it is important to consider not only the supply of food, but also other retail services and to improve existing structures. The needs and perspectives of supply and demand can be determined with the help of scenarios and thus supply gaps can be found (Acocella et al., 2018). GOAT can assist in this process.
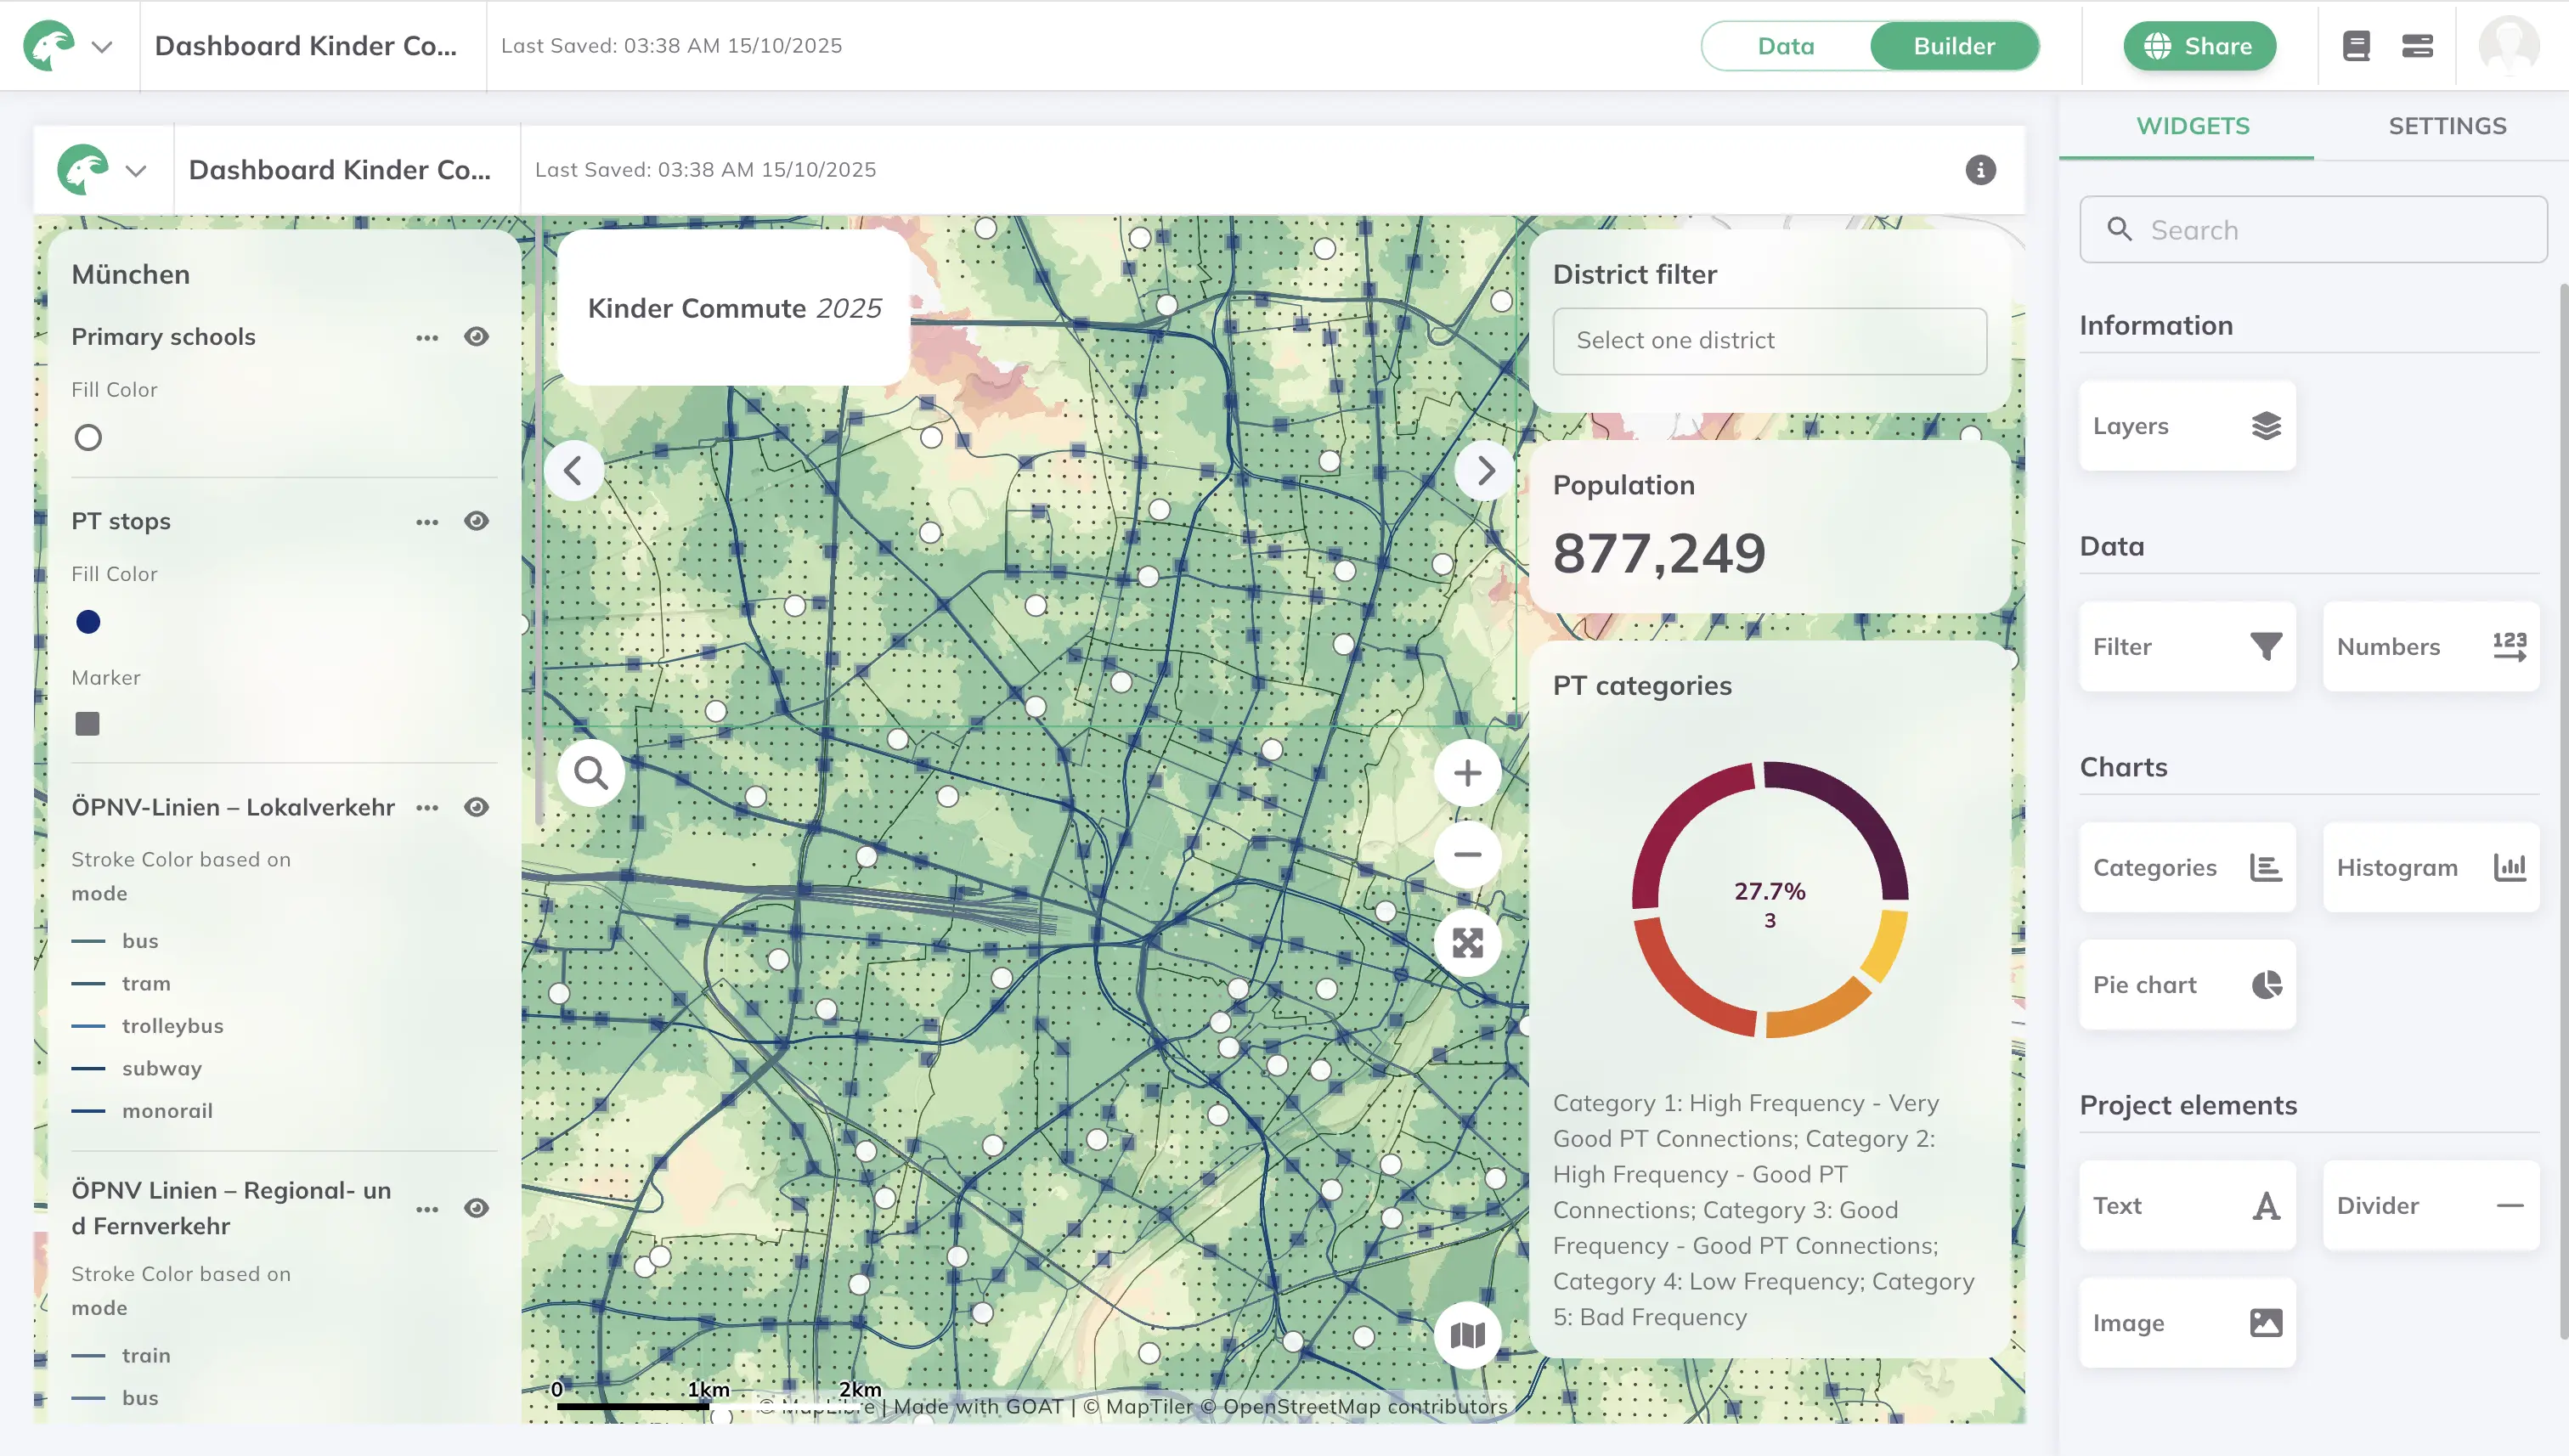
GOAT makes it possible to measure the quality of accessibility of facilities of general interest (e.g., education, health, or culture) in planning decision-making processes. In this way, scenarios can be developed for the effects of new or eliminated facilities on supply. Furthermore, it is possible to evaluate the location quality of residential developments with regard to their accessibility and thus prepare planning decisions for their further development.
The population density can be visualized with the help of a heatmap. If necessary, the tool can be extended to include a layer for changes in the population and its age composition in order to be able to respond more dynamically to a needs-based infrastructure. In addition, retail businesses such as supermarkets can be visualized in GOAT. Available and already used areas for retail can also be shown with the help of the land use layers.
Accessibility heatmaps help planners to quickly and easily identify supply gaps and development potential.

An important point in the local supply strategy is the potential of the inhabitants to be reached, which can be represented with the help of isochrones of the POI (point-of-interest) to be considered. In addition, accessibility plays a decisive role in terms of transport connections: this can be calculated and visualized with GOAT for walking and cycling as well as public transport. This differentiated view of accessibility based on travel time allows for an exact representation of deficits and surpluses in intersected layers, such as accessibility and population density, as well as single and multi-isochrones. In this way, potential areas can be filtered out.

To get a visual overview of the required inhabitants to maintain a business, isochrones could be created that are just as large to capture just that.
Another point where GOAT can contribute is the creation of scenarios and their effects. By creating new POIs, such as a kindergarten, the impact on population accessibility can be outlined and gaps in coverage can be interactively changed or closed. Improvements can thus also be represented quantitatively.

In order to take into account restrictions in opening hours of, for example, craft businesses or supermarkets, a temporal component can be added to the concept of accessibility. In this way, for example, temporarily restricted offers such as mobile stores can be taken into account appropriately.
You also want to perform analyses of bicycle traffic concepts with GOAT or are interested in further functions? Contact us or test the free GOAT demo!
Acocella, D., Helbig, P., von der Heide, J., 2018. Nahversorgungsstrategie für den Landkreis Schweinfurt. Landratsamt Schweinfurt, Schweinfurt/Nürnberg/Lörrach.
.webp)
Insights


GOAT
.png)
.jpg)
.jpg)
.jpg)
.jpg)


Whether you need state-of-the-art GIS technology, extensive datasets or expert advice – we are ready to help you shape a sustainable and liveable future for our community.